The cryptocurrency world has been captivated by Bitcoin’s remarkable ascent in recent months, but the relentless upward trajectory of the Bitcoin price now faces a critical juncture. After reaching significant milestones, a palpable shift in market dynamics suggests that the momentum might be stalling, particularly as the asset approaches crucial resistance levels. This pause in upward movement raises vital questions for investors and traders alike: Is this a temporary consolidation, or are we witnessing the early signs of a more significant pullback? Understanding these dynamics is paramount for anyone navigating the volatile crypto landscape.
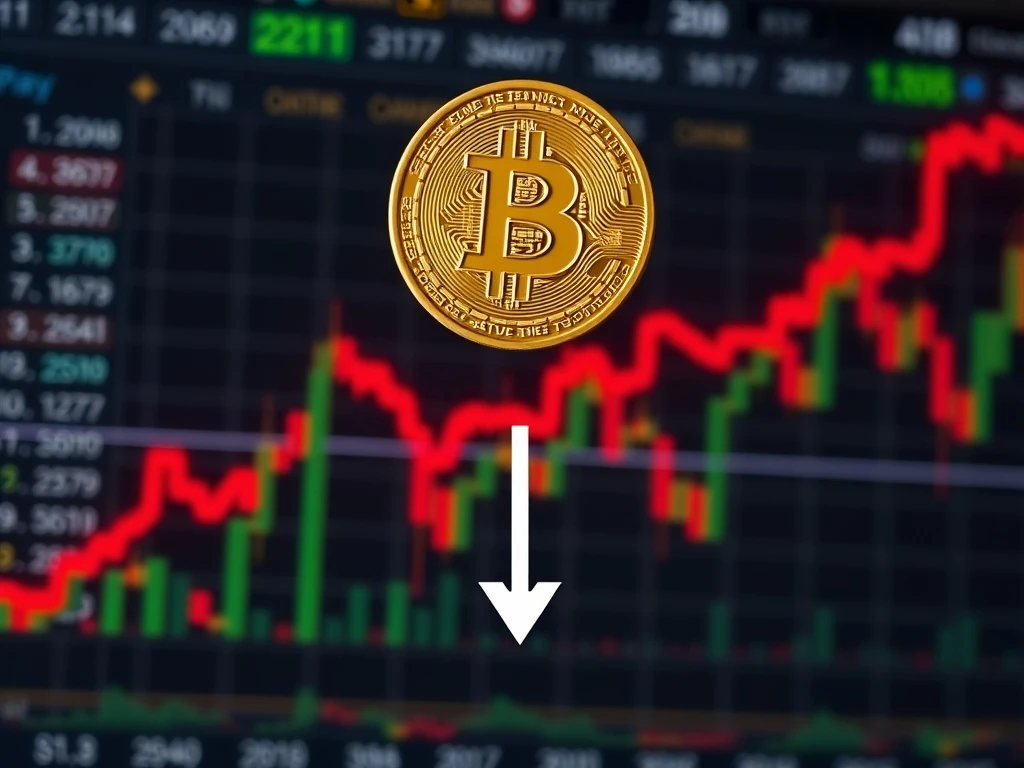
Current Bitcoin Price Dynamics: Why the Stall?
Bitcoin’s journey in the past year has been nothing short of extraordinary, fueled by a confluence of factors including institutional adoption, the approval of spot Bitcoin ETFs, and anticipation surrounding the halving event. These catalysts propelled the Bitcoin price to new all-time highs, igniting optimism across the market. However, as the price pushes into uncharted territory, the buying pressure that once seemed insatiable appears to be waning. We’re observing a period of sideways movement, characterized by increased volatility but a lack of decisive breakouts.
Several factors contribute to this stalling momentum:
- Profit-Taking: After substantial gains, many long-term holders and short-term traders are cashing out, creating selling pressure at higher price points.
- Macroeconomic Uncertainty: Global economic indicators, such as inflation data and interest rate decisions from central banks, can inject caution into risk assets like Bitcoin.
- Exhaustion of Buying Pressure: While new capital continues to flow in, the immediate enthusiasm from the initial ETF excitement may be leveling off, requiring fresh catalysts for sustained upward movement.
- Psychological Barriers: Round numbers and previous all-time highs often act as strong psychological resistance levels where supply tends to outweigh demand.
Understanding Key BTC Resistance Levels: A Deeper Dive
In technical analysis, resistance is a price level where selling interest is strong enough to prevent the price from rising further. Think of it as a ceiling that the price struggles to break through. For Bitcoin, as it ventures into price discovery beyond its previous peaks, identifying these levels becomes crucial. The concept of BTC resistance isn’t just about a single line on a chart; it represents a zone where a significant supply of sellers is waiting.
Why are these levels so important?
- Supply Zones: Historically, these are areas where large numbers of investors who bought at previous highs might be looking to sell to break even or take profits.
- Psychological Barriers: Large, round numbers (e.g., $70,000, $75,000, $80,000, and conceptually even higher targets for long-term outlooks) often act as psychological hurdles that require significant buying power to overcome.
- Technical Indicators: Resistance levels are often identified using various technical tools like Fibonacci retracement/extension levels, pivot points, or even trendlines from previous market tops.
When Bitcoin encounters a strong resistance level, two primary outcomes are common: either the price gets rejected and pulls back, or it consolidates below the resistance, gathering strength for a potential breakout. The current market action suggests the former, with the price struggling to maintain upward velocity.
Is Bitcoin Momentum Fading or Consolidating? Unpacking the Signals
The question on everyone’s mind is whether the current pause in the Bitcoin momentum is a temporary breather before another leg up, or a more concerning sign of a reversal. Momentum refers to the rate of acceleration of price changes. When momentum is strong, prices rise rapidly; when it fades, the ascent slows, or even reverses.
Several indicators help us differentiate between healthy consolidation and fading momentum:
| Indicator | Sign of Fading Momentum | Sign of Healthy Consolidation |
|---|---|---|
| Volume | Declining volume on price rallies, increasing volume on pullbacks. | Decreasing volume during the consolidation phase, sharp increase on breakout attempts. |
| RSI (Relative Strength Index) | Bearish divergence (price makes higher highs, but RSI makes lower highs). | RSI resets to neutral levels (around 50) without forming strong bearish divergences. |
| Price Action | Formation of lower highs and lower lows, breakdown of key support levels. | Sideways movement within a defined range, often forming continuation patterns like flags or pennants. |
Currently, while there are signs of slowing momentum, a definitive reversal is not yet confirmed. The market appears to be in a delicate balance, with buyers and sellers contending for control. Understanding these nuances is vital for accurate forecasting.
Navigating the Broader Crypto Market Analysis: What to Watch
While Bitcoin often dictates the overall market trend, a comprehensive crypto market analysis requires looking beyond just BTC. The broader ecosystem provides critical clues about the market’s health and future direction.
Here are key areas to monitor:
- Altcoin Performance and Bitcoin Dominance: When Bitcoin consolidates or pulls back, altcoins often experience increased volatility. A rising Bitcoin dominance typically means capital is flowing back into BTC, while a falling dominance suggests a potential ‘altcoin season.’
- Macroeconomic Environment: Keep an eye on global inflation rates, central bank interest rate policies, and geopolitical events. These factors significantly influence investor appetite for risk assets.
- On-Chain Metrics: Data directly from the blockchain offers unparalleled transparency.
- Exchange Netflow: A net inflow of Bitcoin to exchanges can indicate an intent to sell, while outflows suggest accumulation.
- Whale Activity: Large transactions by institutional players or high-net-worth individuals can signal significant market moves.
- Long-Term Holder (LTH) Behavior: Are long-term holders selling their coins or continuing to accumulate? Their conviction often signals market bottoming or topping.
- Regulatory Landscape: Upcoming regulatory decisions or statements from governments and financial bodies can have a profound impact on market sentiment and institutional participation.
- News and Narrative Shifts: Major news events, technological breakthroughs, or shifts in public perception can quickly alter market dynamics.
A holistic view, integrating technical analysis with these broader market indicators, provides a more robust understanding of where Bitcoin and the wider crypto market might be headed.
Actionable Insights for Your Bitcoin Trading Strategy: What Should You Do?
Given the current market conditions, what should investors and traders consider for their Bitcoin trading strategy? The approach will vary based on your investment horizon and risk tolerance, but prudence and informed decision-making are universal.
For Long-Term Investors (HODLers):
- Dollar-Cost Averaging (DCA): Continue your regular purchase schedule, regardless of short-term price fluctuations. This strategy mitigates risk and averages out your entry price over time.
- Patience is Key: Focus on Bitcoin’s long-term value proposition and technological advancements rather than daily price movements.
- Avoid Panic Selling: Short-term pullbacks are a normal part of Bitcoin’s volatile history. Reacting emotionally often leads to losses.
For Short-Term Traders:
- Risk Management: Always define your stop-loss levels and position sizing before entering a trade. Volatility can lead to rapid price swings.
- Patience for Confirmation: Instead of chasing pumps, wait for clear breakouts above resistance or confirmed bounces from support levels. False breakouts are common.
- Identify Key Support Levels: If Bitcoin fails to break resistance, identify potential support zones where it might find buyers (e.g., previous highs, significant moving averages).
- Utilize Technical Analysis: Employ tools like moving averages, Fibonacci levels, and chart patterns to identify potential entry and exit points.
- Stay Informed: Keep a close watch on news, social media sentiment, and on-chain data to anticipate market shifts.
The primary challenge in such a market is managing emotions. Fear of missing out (FOMO) during rallies and fear, uncertainty, and doubt (FUD) during corrections can lead to poor decisions. The benefit of a well-thought-out strategy is that it provides a framework for decision-making, reducing the impact of emotional biases.
Conclusion: Patience and Prudence in a Volatile Market
The current stall in Bitcoin price momentum at key resistance levels is a natural, albeit sometimes unsettling, part of any asset’s price discovery phase. It’s a period of consolidation, where the market digests recent gains and prepares for its next move. While the immediate future remains uncertain, this isn’t necessarily a cause for alarm, but rather a call for heightened awareness and strategic planning.
Understanding the nuances of BTC resistance, assessing Bitcoin momentum, conducting thorough crypto market analysis, and refining your Bitcoin trading strategy are essential for navigating these waters. Whether you are a long-term holder or an active trader, the principles of patience, risk management, and continuous learning remain paramount. The crypto market continues to evolve rapidly, and staying informed and disciplined will be your greatest assets in seizing future opportunities.
Related News
- CLARITY Act Breakthrough: White House Official Reveals Banks Poised for Massive Crypto Market Entry
- Blockchain Technology Poised to Revolutionize Global GDP Growth, Citizens Bank Analysis Reveals
- Chainlink Undervalued: Bitwise CIO Reveals the Critical Infrastructure Powering the Next Financial System