In the volatile world of cryptocurrency trading, liquidation heatmaps and charts have become indispensable tools for managing the risks of leveraged positions. These visual aids provide traders with critical insights into market dynamics, helping them anticipate volatility and avoid costly forced liquidations. But how exactly do they work, and why are they so crucial for crypto traders?
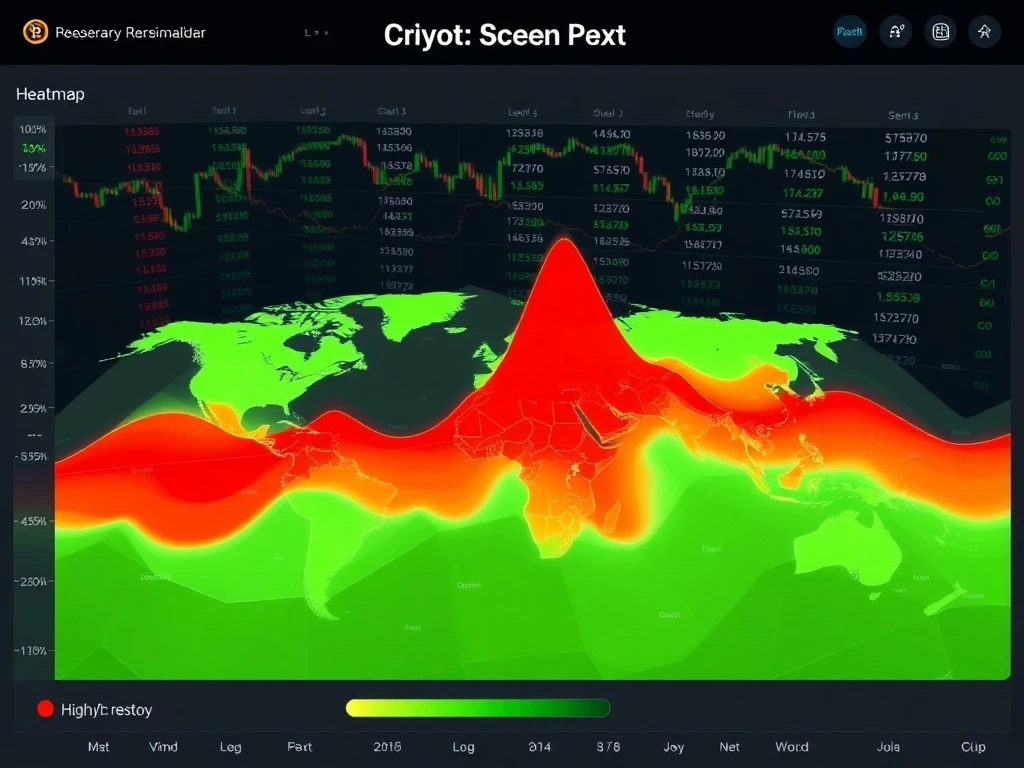
What Are Liquidation Heatmaps and How Do They Work?
Liquidation heatmaps visualize price zones where leveraged positions are concentrated, highlighting areas prone to cascading liquidations. Here’s what you need to know:
- Color-coded risk zones: Darker hues (red/orange) indicate high-density clusters of long or short positions, while lighter colors (yellow/green) denote lower risk.
- Actionable insights: Traders can identify potential support/resistance levels and avoid entering positions near high-risk clusters.
- Platforms like Coinglass and CoinAnk offer advanced heatmap functionalities, integrating leverage ratios and real-time data.
Why Liquidation Charts Matter for Crypto Derivatives Trading
Liquidation charts track historical liquidation events, providing a deeper understanding of market momentum. Key features include:
- Vertical bars: Represent total liquidations, with red bars indicating long liquidations (price drops) and green bars reflecting short liquidations (price rallies).
- Market sentiment analysis: Repeated liquidations at specific price levels reveal weak support or strong resistance zones.
- Strategic advantage: Traders can refine entry/exit strategies by analyzing historical liquidation patterns.
How to Use Liquidation Heatmaps for Risk Management
Effective risk management in crypto leveraged trading involves:
- Avoiding high-risk clusters: Entering positions near dense liquidation zones increases the likelihood of forced closures.
- Timing market entries: Post-liquidation rebounds often present lucrative opportunities.
- Combining tools: Use heatmaps alongside liquidation charts for a comprehensive market view.
The Future of Liquidation Tools in Crypto Trading
As crypto derivatives markets evolve, liquidation heatmaps and charts will remain vital for:
- Preserving capital: Identifying structural vulnerabilities in leveraged positions helps traders mitigate losses.
- Navigating volatility: Real-time heatmap tools empower traders to react swiftly to market shifts.
- Capitalizing on sentiment shifts: Understanding whale behavior and market sentiment is easier with visual data.
In conclusion, liquidation heatmaps and charts are more than analytical tools—they are essential for anyone trading crypto leveraged positions. By leveraging these instruments, traders can navigate market volatility with confidence and precision.
Frequently Asked Questions (FAQs)
What is a liquidation heatmap in crypto trading?
A liquidation heatmap visualizes price zones where leveraged positions are concentrated, helping traders identify high-risk areas prone to forced liquidations.
How do liquidation charts differ from heatmaps?
Liquidation charts track historical liquidation events over time, while heatmaps provide a snapshot of current risk zones.
Which platforms offer liquidation heatmap tools?
Platforms like Coinglass and CoinAnk provide advanced heatmap functionalities for crypto traders.
Why are liquidation tools important for risk management?
They help traders avoid high-risk zones, time market entries, and mitigate exposure to forced closures.
Can liquidation heatmaps predict market crashes?
While they can’t predict crashes, they highlight zones where cascading liquidations are likely, signaling potential volatility.
Related News
- Bitcoin Price Plummets Below $76,000: Analyzing the Sudden Market Shift
- TeraWulf Shares Skyrocket After Strategic Acquisition of Two Major Bitcoin Mining Sites
- Bitcoin OG’s Stunning $44.9M ETH Move to Binance Follows Catastrophic $230M Liquidation