SEI’s price action is under scrutiny as it dips 3.1%, trapped within a descending channel. The 10-day SMA at $0.34 is proving to be a critical level, with resistance at $0.3486 capping upward moves. Will this consolidation lead to a breakout or further decline?
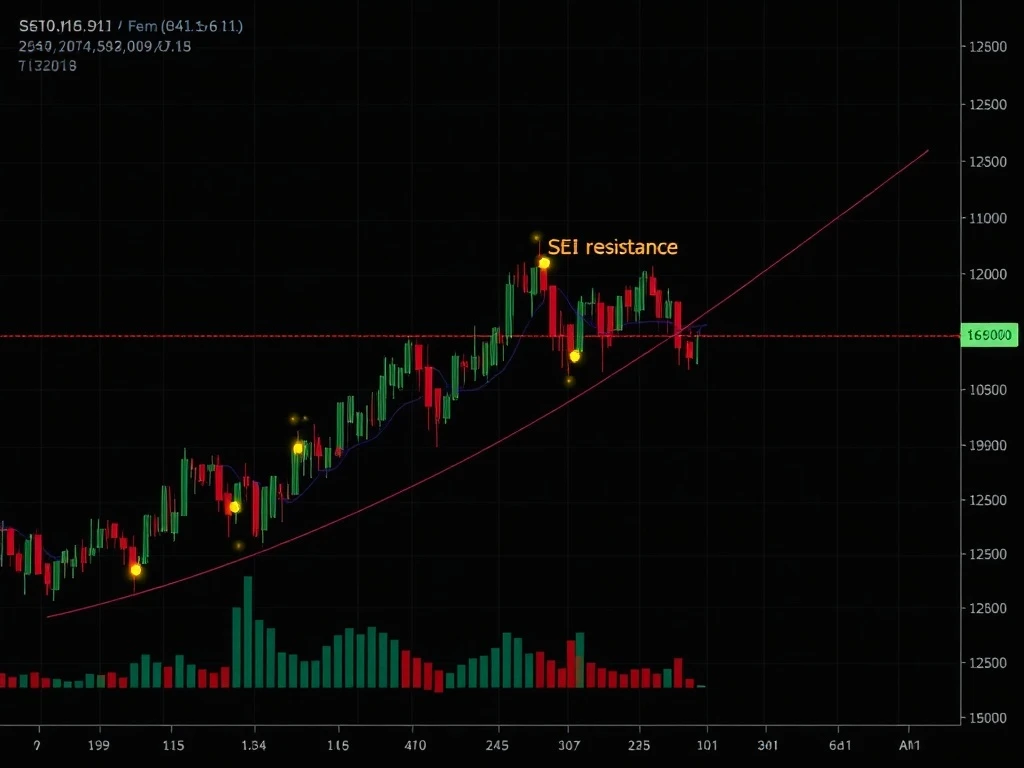
SEI Price Faces Key Resistance at $0.3486
SEI’s current price of $0.3408 reflects a 3.1% decline over the past week. The cryptocurrency is confined within a descending channel, with:
- Support at $0.329
- Resistance at $0.3486
- 10-day SMA acting as dynamic support/resistance at $0.34
Why the 10-Day SMA Matters for SEI
The 10-day simple moving average has become a crucial indicator for SEI traders. Recent price action shows:
| Level | Significance |
|---|---|
| $0.34 | Strong reaction point for intraday trading |
| $0.3486 | Key resistance that could trigger bullish momentum |
| $0.329 | Critical support level to watch |
Potential Bullish Scenario for SEI
Analysts suggest that a breakout above $0.3486 could:
- Target $0.49 retracement level
- Shift market sentiment
- Challenge the descending channel structure
FAQs About SEI’s Price Movement
Q: What does the descending channel mean for SEI?
A: It indicates a current downtrend, with price bouncing between defined support and resistance levels.
Q: How significant is the 10-day SMA for SEI?
A: Extremely significant – it’s acting as both support and resistance, guiding short-term trading decisions.
Q: What volume is needed for a breakout?
A: Sustained high volume would be required to confirm any breakout above $0.3486.
Q: What’s the worst-case scenario for SEI?
A: A breakdown below $0.329 support could lead to further declines.
Related News
- Crypto Futures Liquidations Unleash $115M Storm as ETH and BTC Longs Face Brutal 24-Hour Squeeze
- Bank of Japan Holds Steady: Crucial 0.75% Rate Decision Defies Global Pressure
- Ripple’s Strategic Masterstroke: Expanding Into Core Banking Through DXC’s $5 Trillion Platform