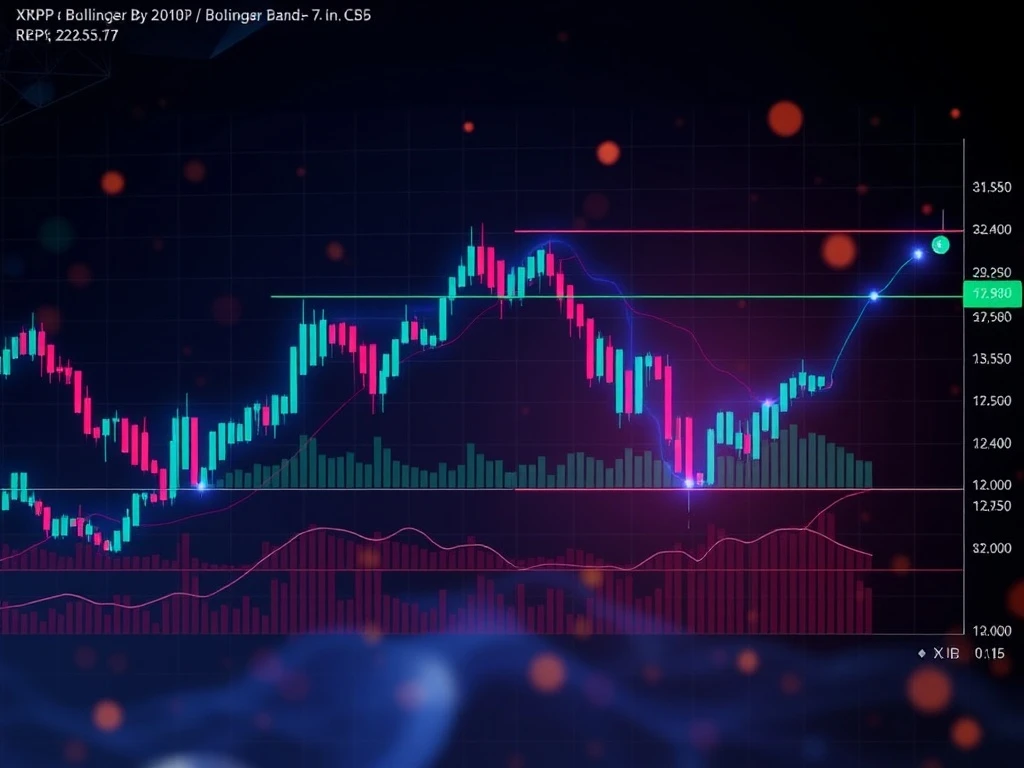
Ripple (XRPUSDT) has shown remarkable strength in the last 24 hours, breaking key resistance levels and forming a bullish engulfing pattern. Traders are eyeing this momentum as a potential signal for further upside. Let’s dive into the details of this exciting development.
Ripple XRPUSDT: Key Price Movements
Ripple (XRPUSDT) traded between $3.0533 and $3.1624, closing at $3.1276. The late-day rally pushed prices above critical resistance, supported by a surge in volume. Here’s a breakdown of the key levels:
- Support: $3.09–$3.10 and $3.07–$3.08
- Resistance: $3.12–$3.14 (broken late in the session)
Bullish Engulfing Pattern: What It Means
The 15-minute chart revealed a bullish engulfing pattern around $3.12–$3.13, indicating a shift from bearish to bullish sentiment. This pattern often precedes upward momentum, making it a critical signal for traders.
RSI and MACD: Momentum Indicators
The RSI climbed to 66, nearing overbought territory, while the MACD line crossed above the signal line. These indicators suggest strong bullish momentum but also hint at potential pullbacks.
Bollinger Bands and Fibonacci Retracement
Bollinger Bands widened, reflecting increased volatility. Meanwhile, Fibonacci retracement levels showed strong buying interest at $3.128 (61.8% level), reinforcing the upward trend.
Volume and Turnover: Confirming the Rally
Volume spiked in the final 6 hours, aligning with price action and suggesting accumulation by larger participants. No divergence between price and volume was observed, validating the upward move.
What’s Next for Ripple XRPUSDT?
Traders may look for a test of the $3.15–$3.16 range, with potential pullbacks to $3.12–$3.13 as entry points. However, caution is advised as RSI approaches overbought levels.
Frequently Asked Questions (FAQs)
Q: What is a bullish engulfing pattern?
A: A bullish engulfing pattern is a candlestick formation where a larger bullish candle completely engulfs the previous bearish candle, signaling a potential reversal.
Q: Why is RSI important in trading?
A: RSI measures the speed and change of price movements, helping traders identify overbought or oversold conditions.
Q: How do Bollinger Bands work?
A: Bollinger Bands measure volatility by plotting standard deviations around a moving average, indicating potential breakouts or reversals.
Q: What does Fibonacci retracement indicate?
A: Fibonacci retracement levels highlight potential support and resistance areas based on key ratios derived from the Fibonacci sequence.