Neiro Ethereum (NEIROUSDT) has experienced a volatile 24-hour trading session, presenting both challenges and opportunities for traders. This technical breakdown provides actionable insights to navigate the market effectively.
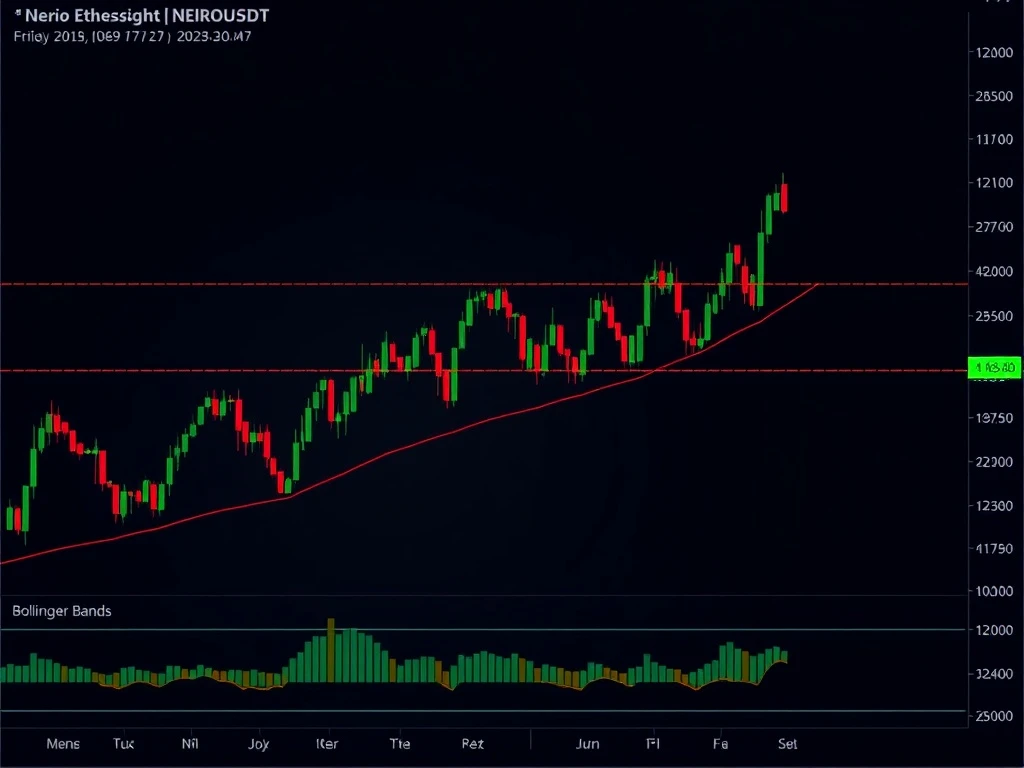
Neiro Ethereum Price Action: A Rollercoaster Ride
The session opened at 0.00042421 and closed at 0.0004089, marking a significant decline. Key observations:
- Price broke below critical support at 0.0004200
- Bearish engulfing and dark cloud cover patterns confirmed the downtrend
- Total volume reached 8,824,126,490.0 with $3,695,629.00 in turnover
Technical Indicators: What Do They Reveal?
The technical landscape shows mixed signals:
| Indicator | Observation |
|---|---|
| Moving Averages | Price closed below 20, 50, 100, and 200-period MAs |
| RSI | Dipped below 30, signaling potential oversold conditions |
| MACD | Bearish crossover below zero line |
| Bollinger Bands | Price trading near lower band, indicating high volatility |
Fibonacci Retracement: Critical Levels to Watch
The Fibonacci levels from the 0.00043033 high are now crucial:
- 38.2% at 0.0004219 (broken)
- 61.8% at 0.00041634 (current support)
- 78.6% at 0.0004097 (next potential support)
Trading Strategy for NEIROUSDT
Consider these approaches:
- Watch for potential bounce at 0.0004097 support
- Monitor RSI divergence for reversal signals
- Volume spikes could indicate continuation or exhaustion
- Consider risk management strategies given the volatility
Conclusion: Navigating the NEIROUSDT Market
The Neiro Ethereum market presents both risk and opportunity. Traders should remain vigilant, watching key technical levels and indicators for potential entry and exit points. The current oversold conditions might present short-term opportunities, but the overall trend remains bearish until proven otherwise.
Frequently Asked Questions
Q: What caused the sharp decline in NEIROUSDT?
A: The breakdown below 0.0004200 support triggered stop losses and attracted bearish momentum.
Q: Is this a good time to buy NEIROUSDT?
A: While RSI shows oversold conditions, traders should wait for confirmation of a reversal before entering long positions.
Q: What’s the most important level to watch now?
A: The 61.8% Fibonacci level at 0.00041634 is currently acting as support, while 0.0004097 is the next potential support.
Q: How reliable are these technical indicators?
A: While technical analysis provides valuable insights, it should be combined with other factors like market sentiment and fundamentals for better decision-making.
Related News
- Trend Research ETH Deposit: Strategic $23.3M Move to Binance Reveals Calculated Crypto Liquidation
- Binance Bitcoin Buying Plan: Strategic $1B Execution Signals Major Institutional Shift
- Spot ETH ETFs Face Alarming Third Straight Day of Net Outflows as BlackRock Leads $15.58M Withdrawal