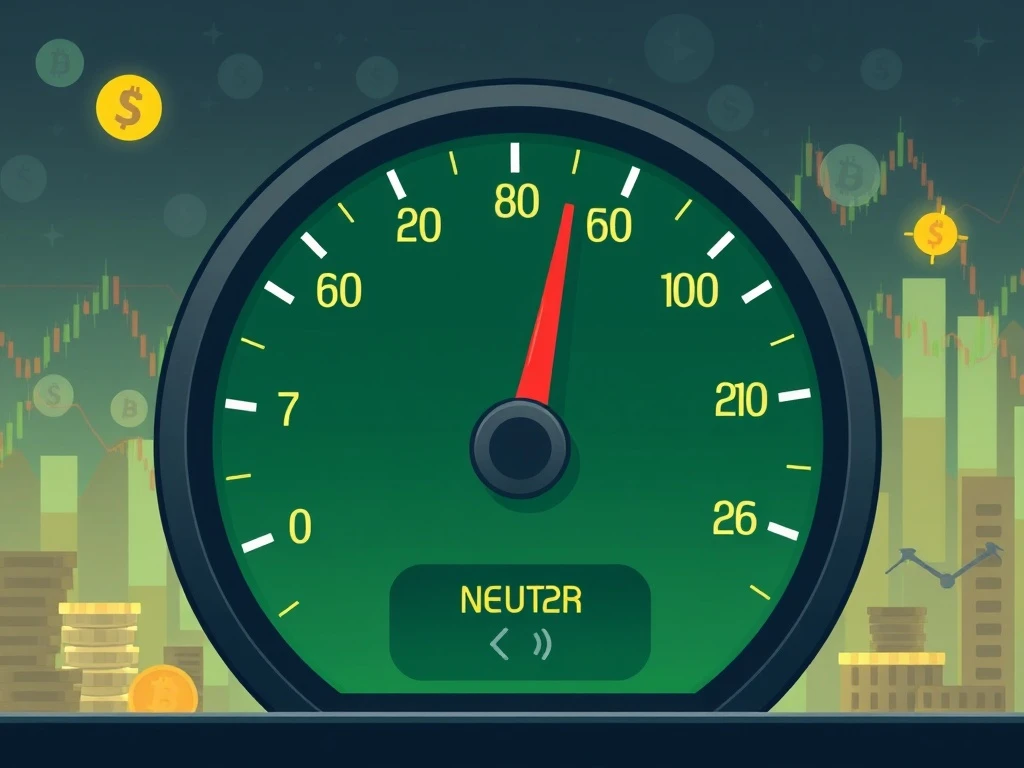
The cryptocurrency market often feels like a rollercoaster, doesn’t it? One day, optimism soars; the next, caution prevails. For this reason, understanding the collective mood of investors becomes paramount. This is precisely where the Crypto Fear & Greed Index offers invaluable insight. Today, this key indicator registers a reading of 48, signaling a ‘Neutral’ sentiment across the digital asset landscape. This minor dip from yesterday’s 51 suggests a slight cooling, yet the overall mood remains balanced. Therefore, grasping the components of this index helps investors make more informed decisions.
Understanding the Crypto Fear & Greed Index
The Crypto Fear & Greed Index serves as a vital barometer for the cryptocurrency market. It distills complex market data into a single, easily understandable number. This index, provided by Alternative.me, ranges from 0 to 100. A score of 0 signifies ‘Extreme Fear,’ indicating investors are highly worried and potentially overselling. Conversely, a score of 100 points to ‘Extreme Greed,’ suggesting euphoria and a possible market bubble.
The current reading of 48 firmly places the market in a ‘Neutral’ zone. This means neither extreme panic nor excessive exuberance dominates. Instead, a more balanced outlook prevails among participants. Many factors contribute to this composite score. Each component carries a specific weight, influencing the final index number. Consequently, understanding these elements provides a clearer picture of market dynamics.
Diving Deeper into Market Sentiment
Measuring market sentiment in the fast-paced crypto world requires a sophisticated approach. The Crypto Fear & Greed Index accomplishes this by analyzing six distinct data points. Each point reflects a different facet of investor behavior and market activity. By combining these, the index provides a holistic view. Therefore, it offers a powerful tool for gauging the prevailing mood. Let’s explore these crucial components.
The index breaks down its calculation into these key areas:
- Volatility (25%): This measures current price fluctuations and drawdowns compared to historical averages. Higher volatility often signals fear or uncertainty.
- Trading Volume (25%): Strong, consistent trading volumes suggest healthy market interest. Low volumes, however, can indicate a lack of conviction.
- Social Media Mentions (15%): The volume and sentiment of crypto-related discussions on platforms like Twitter are analyzed. A surge in positive mentions can signal greed.
- Surveys (15%): While currently paused, these polls directly ask investors about their market outlook. They offer direct insight into psychological drivers.
- Bitcoin’s Market Cap Dominance (10%): An increasing Bitcoin dominance often suggests a flight to safety, indicating fear. A decreasing dominance can point to altcoin speculation, reflecting greed.
- Google Search Volume (10%): Tracking search trends for terms like ‘Bitcoin price manipulation’ or ‘how to buy crypto’ can reveal underlying fear or interest.
Each of these factors plays a pivotal role. They collectively paint a picture of the current investor mindset. Thus, the index becomes a valuable guide.
How Crypto Volatility Shapes Investor Behavior
Crypto volatility is a defining characteristic of the digital asset space. Price swings of 10% or more in a single day are not uncommon. The Crypto Fear & Greed Index dedicates a significant 25% of its weighting to this factor. High volatility often correlates with increased fear. Investors become more cautious when prices fluctuate wildly. They might sell assets to protect gains or limit losses. Conversely, periods of lower volatility can foster a sense of calm. This stability might encourage more measured investment decisions. Therefore, monitoring volatility helps assess the market’s current risk appetite.
When volatility spikes, it frequently triggers emotional responses. Traders might act impulsively. However, seasoned investors often view volatility as an opportunity. They look for entry or exit points during these periods. The index captures this sentiment effectively. It translates raw price movement into a sentiment score. Thus, it offers a quick glance at the market’s reaction to price instability.
The Crucial Role of Trading Volume
Another major contributor to the index, also weighted at 25%, is trading volume. This metric represents the total amount of a cryptocurrency bought and sold over a specific period. High trading volume generally indicates strong market interest and liquidity. When a price movement is accompanied by high volume, it suggests conviction behind that move. For instance, a price rally with robust volume often signals genuine buying pressure.
Conversely, low trading volume can indicate a lack of interest or indecision. A price increase on low volume might not be sustainable. It could signal a ‘dead cat bounce’ rather than a true recovery. Therefore, the index uses trading volume to confirm the strength of market trends. It helps differentiate between speculative surges and fundamental shifts. A healthy volume reading contributes to a neutral or even greedy sentiment, while dwindling volumes can signal underlying fear.
Bitcoin Dominance: A Barometer for the Market
Bitcoin dominance refers to Bitcoin’s market capitalization as a percentage of the total cryptocurrency market cap. This metric holds significant weight (10%) in the Fear & Greed Index for a specific reason. Bitcoin is often considered the ‘safe haven’ of the crypto world. When investors are fearful, they tend to move their funds from riskier altcoins back into Bitcoin. This increases Bitcoin’s dominance. It reflects a ‘flight to safety’ mentality.
Conversely, when greed prevails, investors often take more risks. They move capital into altcoins, hoping for higher returns. This action decreases Bitcoin’s dominance. Therefore, a rising dominance often signals fear, while a falling dominance can indicate growing optimism or greed. The index cleverly integrates this dynamic. It uses Bitcoin’s position to gauge broader market confidence. A stable dominance contributes to a neutral reading.
Decoding the Neutral Zone: Implications for Traders
A ‘Neutral’ reading on the Crypto Fear & Greed Index, like the current 48, presents an interesting scenario. It means the market lacks a strong directional bias. Neither buyers nor sellers are in overwhelming control. This period can often precede a significant move, but it provides no immediate indication of direction. For traders, this requires careful consideration. It suggests a time for observation rather than aggressive positioning.
During neutral periods, the market might consolidate. Prices could trade within a defined range. This can be frustrating for those seeking quick profits. However, it also offers opportunities for range-bound strategies. It is crucial to avoid making impulsive decisions based on short-term fluctuations. Instead, focus on technical analysis and fundamental developments. A neutral index reading encourages a balanced and cautious approach.
Social Media Buzz and Google Search Trends
The digital age means information spreads instantly. Social media platforms, therefore, act as powerful amplifiers of sentiment. The Crypto Fear & Greed Index allocates 15% to social media mentions. It analyzes the volume and sentiment of crypto-related discussions. A sudden surge in positive, hyped discussions can signal ‘greed.’ Conversely, widespread negative commentary often reflects ‘fear.’ This component captures the collective emotional pulse of the community.
Similarly, Google search volume (10%) provides insight into public interest. Searches for terms like ‘Bitcoin price prediction’ or ‘buy Ethereum’ can indicate growing interest or speculation. On the other hand, searches for ‘crypto scam’ or ‘how to withdraw crypto’ might suggest fear or uncertainty. These two components offer a glimpse into the public’s current engagement and emotional state regarding cryptocurrencies. They act as digital whispers, reflecting the underlying mood.
Navigating the Nuances of Index Movements
The Crypto Fear & Greed Index is not a static measure. It constantly shifts, reflecting the dynamic nature of the crypto market. A movement of three points, as seen recently, might seem small. However, it indicates a subtle shift in the underlying sentiment. Traders and investors closely monitor these changes. They use them to refine their strategies. For example, a sustained move towards ‘Extreme Fear’ might signal a buying opportunity for contrarian investors. Historically, buying during peak fear has often yielded significant returns.
Conversely, a prolonged period of ‘Extreme Greed’ could signal an impending correction. This might prompt cautious investors to take profits. However, the index should not be used in isolation. It functions best when combined with other analytical tools. Price action, technical indicators, and fundamental analysis provide a more complete picture. The index serves as an excellent sentiment overlay. It helps confirm or challenge other market signals.
Practical Strategies for a Neutral Market
When the market sentiment is neutral, as indicated by a score of 48, specific strategies become more relevant. Firstly, consider a ‘wait and see’ approach. Avoid making large, directional bets. Instead, focus on smaller, more precise trades. Range trading strategies can be effective. Identify support and resistance levels. Then, buy near support and sell near resistance. This capitalizes on the market’s current lack of strong direction.
Secondly, use this period for research and portfolio rebalancing. Review your current holdings. Are they still aligned with your long-term goals? This neutral phase offers a calmer environment for such evaluations. Thirdly, consider dollar-cost averaging (DCA). This strategy involves investing a fixed amount of money at regular intervals. It helps mitigate the impact of market volatility. It also removes the emotional element of trying to ‘time the market.’ A neutral index reading provides a good backdrop for consistent DCA. It reduces the risk of buying at extreme highs.
Limitations and Future of the Index
While the Crypto Fear & Greed Index is a valuable tool, it does have limitations. Firstly, it is primarily based on Bitcoin data. While Bitcoin heavily influences the market, altcoins can sometimes move independently. Secondly, sentiment can change rapidly. The index provides a snapshot, but market conditions evolve quickly. Thirdly, it is a lagging indicator in some respects. It reflects sentiment that has already developed. It does not predict future price movements with certainty.
Despite these points, the index remains a powerful aid. It helps investors understand the emotional state of the market. Its methodology continually evolves. As the crypto space matures, so too will the tools used to analyze it. Future iterations might incorporate more sophisticated AI-driven sentiment analysis. They might also expand to cover a wider range of cryptocurrencies. For now, it serves as a reliable guide for many.
Conclusion: Staying Informed in a Dynamic Market
The current ‘Neutral’ reading of 48 on the Crypto Fear & Greed Index highlights a period of balance in the cryptocurrency market. It reflects a nuanced interplay of factors, from crypto volatility and trading volume to Bitcoin dominance and social media trends. While not a crystal ball, this index provides a crucial snapshot of collective investor psychology. It encourages a thoughtful, rather than reactive, approach to trading and investing. Staying informed about such indicators is essential. It empowers investors to navigate the exciting yet unpredictable world of digital assets with greater confidence and strategic foresight. Therefore, continue to monitor this index and combine its insights with thorough research. This practice will serve you well in the dynamic crypto landscape.
Frequently Asked Questions (FAQs)
What does a ‘Neutral’ reading on the Crypto Fear & Greed Index mean?
A ‘Neutral’ reading, like the current 48, indicates that the market is neither dominated by extreme fear nor extreme greed. Investors generally feel balanced, lacking a strong directional bias. This period often suggests consolidation or uncertainty about the next major market move.
How is the Crypto Fear & Greed Index calculated?
The index is calculated using a weighted average of several factors. These include volatility (25%), trading volume (25%), social media mentions (15%), surveys (15%), Bitcoin’s market cap dominance (10%), and Google search volume (10%). Each factor contributes to the overall sentiment score from 0 (Extreme Fear) to 100 (Extreme Greed).
Why is Bitcoin dominance included in the index calculation?
Bitcoin dominance is included because Bitcoin often acts as a ‘safe haven’ in the crypto market. An increasing Bitcoin dominance typically signals fear, as investors move funds from riskier altcoins into Bitcoin. Conversely, decreasing dominance can indicate a more speculative, greedy market as altcoins gain favor.
Can I use the Crypto Fear & Greed Index to predict market movements?
The Crypto Fear & Greed Index is a sentiment indicator, not a predictive tool. It reflects the current emotional state of the market. While extreme readings (Extreme Fear or Extreme Greed) can sometimes precede market reversals, it should always be used in conjunction with other technical and fundamental analysis tools for more comprehensive decision-making.
What strategies are advisable during a ‘Neutral’ market sentiment?
During a neutral market, strategies like ‘wait and see,’ range trading, and dollar-cost averaging (DCA) can be effective. It’s a good time for research, portfolio rebalancing, and avoiding impulsive decisions. The absence of strong directional momentum encourages a cautious and analytical approach.
Related News
- Coinone SENT Listing: Strategic Expansion Brings New Trading Opportunities to South Korea
- Bithumb DYDX Suspension: Essential Guide to the Jan. 30 Network Upgrade Disruption
- Chainlink Unlocks Revolutionary 24/5 Onchain Access to US Stocks