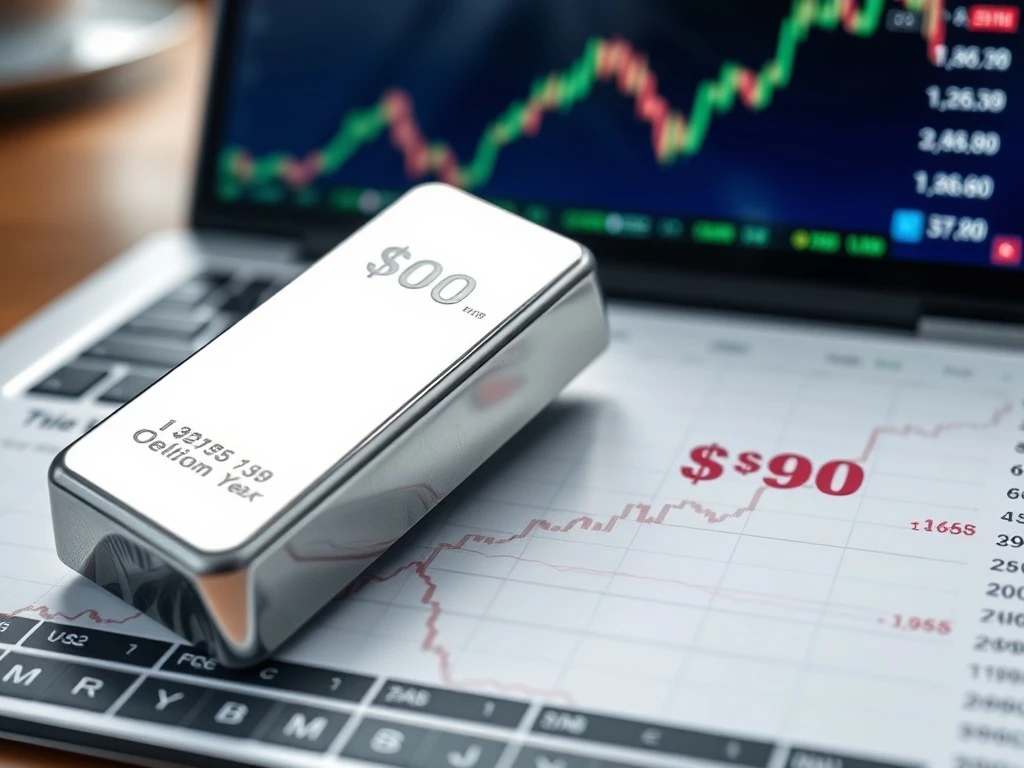
In a stunning market development on April 10, 2025, the spot price of silver surged to a historic milestone, briefly eclipsing the $90 per ounce barrier for the very first time. This unprecedented rally represents a seismic shift in the precious metals landscape, fundamentally altering long-held price paradigms and capturing the attention of global investors and industrial consumers alike. The metal subsequently settled at $89.56, marking a powerful single-day gain of 5.16% and cementing a new all-time high that analysts are now scrutinizing for its broader economic signals.
Spot Silver Price Reaches Uncharted Territory
The breach of the $90 level for spot silver is not merely a numerical milestone. It signifies a decisive break from a multi-decade trading range that had previously constrained the metal’s potential. Market data from the London Bullion Market Association (LBMA) confirms this record-setting move. Consequently, traders witnessed intense volatility during the Asian and European trading sessions. This price action reflects a potent confluence of macroeconomic forces currently reshaping global commodity markets. Furthermore, the rally demonstrates a significant decoupling from traditional correlations, as silver often amplifies moves seen in its sister metal, gold.
The Technical and Fundamental Breakdown
Analyzing the price chart reveals a powerful breakout from a prolonged consolidation pattern. Key resistance levels at $85 and $88 were swiftly overcome with substantial trading volume. The current spot price of $89.56 establishes a formidable new support zone for future trading. From a fundamental perspective, the physical market shows clear signs of strain. Reported inventories in COMEX-approved warehouses have trended downward for seven consecutive months. Simultaneously, premiums for physical silver bars and coins remain elevated in major markets worldwide, indicating robust retail and institutional demand that outstrips immediate supply.
Drivers Behind the Precious Metals Rally
Several interconnected factors are fueling this historic surge in the silver market. Primarily, persistent global inflationary pressures continue to erode fiat currency values, driving capital into tangible assets. Central bank policies, particularly regarding interest rate trajectories and quantitative tightening, remain a critical focal point for metals investors. Additionally, escalating geopolitical tensions in resource-rich regions have amplified safe-haven demand. The structural supply-demand equation for silver has also tightened considerably. Industrial consumption, especially in the solar photovoltaic and electric vehicle sectors, is growing at a double-digit annual rate, according to reports from the Silver Institute.
- Monetary Policy & Inflation: Real interest rates, adjusted for inflation, remain deeply negative in many economies, diminishing the opportunity cost of holding non-yielding assets like silver.
- Industrial Demand Surge: Silver is a critical component in electronics, green energy technologies, and automotive applications, creating a consistent and growing consumption base.
- Investment Inflows: Holdings in silver-backed exchange-traded funds (ETFs) have seen notable inflows over the past quarter, reversing a previous trend of outflows.
- Currency Dynamics: A measured weakening of the US dollar index (DXY) has provided a tailwind for dollar-denominated commodities, including silver.
Historical Context and Market Comparisons
To fully appreciate the magnitude of the move above $90, one must examine silver’s price history. The previous all-time high, adjusted for inflation, was set in 1980 during the Hunt brothers’ attempt to corner the market. In nominal terms, that peak equated to approximately $50 per ounce. The journey to the current level has been characterized by extreme volatility and prolonged periods of stagnation. A comparison with gold, often measured by the gold-to-silver ratio, is particularly instructive. This ratio, which indicates how many ounces of silver are needed to buy one ounce of gold, has compressed dramatically from over 80:1 to near 60:1, signaling silver’s outperformance in the current cycle.
| Year | Price | Key Event / Context |
|---|---|---|
| 1980 | ~$50 | Previous nominal high; Hunt brothers speculation. |
| 2011 | ~$49 | Post-Financial Crisis rally; debt ceiling concerns. |
| 2020 | ~$29 | COVID-19 pandemic volatility and stimulus response. |
| 2025 | >$90 | New All-Time High; green energy demand, monetary inflation. |
Expert Analysis on Sustainability
Market analysts offer varied perspectives on the rally’s longevity. Dr. Elena Vance, a senior commodity strategist at Meridian Capital, notes, “The convergence of monetary debasement fears and tangible industrial demand creates a unique bullish case for silver that differs from past cycles. The supply response from mining is lagging, with lead times for new projects exceeding seven years.” Conversely, some voices caution about potential short-term corrections. Portfolio manager David Chen highlights the role of speculative futures positioning on the COMEX, which recently reached elevated levels that have sometimes preceded periods of consolidation. However, the overarching consensus points to a structurally tighter market for the foreseeable future.
Economic and Industrial Implications
The soaring spot silver price carries significant consequences beyond the trading desks. For industries, rising input costs for components containing silver, such as semiconductors, conductive pastes, and medical devices, may pressure profit margins. Manufacturers may accelerate research into substitution materials, though silver’s unique properties often make this challenging. For consumers, the cost of products like solar panels and certain electronics could see upward pressure. On a macroeconomic level, silver’s performance is increasingly viewed as a barometer for both inflation expectations and confidence in the energy transition. Its price movement now provides critical data points for policymakers assessing the health of industrial supply chains.
Conclusion
The spot silver price achieving a new all-time high above $90 per ounce marks a definitive chapter in financial market history. This event is driven by a powerful synthesis of investment demand for inflation protection and robust, inelastic consumption from the global technology and green energy sectors. While volatility is an inherent characteristic of the silver market, the fundamental underpinnings of this rally appear more diversified and structurally sound than in previous speculative peaks. As the world navigates complex economic transitions, the price of silver will likely remain a key indicator to watch, reflecting the ongoing tension between monetary policy, industrial innovation, and raw material scarcity. The breach of the $90 level is therefore not an endpoint, but a significant marker in an evolving narrative for this critical precious and industrial metal.
FAQs
Q1: What exactly is the “spot price” of silver?
The spot price refers to the current market price for immediate delivery and payment of silver. It is the benchmark price for physical metal transactions and is determined by trading activity on major global over-the-counter (OTC) markets like the LBMA.
Q2: How does the current silver price compare to its inflation-adjusted historical high?
While the nominal price is now above $90, the inflation-adjusted high from 1980 is estimated to be equivalent to over $200 in today’s dollars, using the Consumer Price Index (CPI). This historical context shows that, in real terms, silver has not yet reached its prior peak.
Q3: Why is industrial demand so important for silver’s price?
Unlike gold, which is primarily held for investment and jewelry, over 50% of annual silver demand comes from industrial applications. This creates a consistent consumption base that supports the price floor and links its value directly to global manufacturing and technology growth.
Q4: What is the gold-to-silver ratio, and why does it matter?
The gold-to-silver ratio measures how many ounces of silver it takes to buy one ounce of gold. A falling ratio, as seen recently, indicates that silver is outperforming gold. Historically, the ratio has averaged around 60:1, and its movement is closely watched by precious metals investors for trading signals.
Q5: Can high silver prices lead to increased mining supply?
Yes, higher prices incentivize mining companies to develop new projects and expand existing operations. However, the lead time for bringing a new silver mine into production is typically 7-10 years, meaning the supply response is slow and cannot quickly alleviate a shortage, contributing to sustained price strength.
Related News
- Decentralized GPU Cloud Infrastructure Pioneers Revolutionary Partnership Between Salad.com and Golem Network
- MEVerse Launches Critical 5-Hour Maintenance to Resolve Urgent Mainnet Network Error
- Crypto Whale’s Shocking Pivot: Secures $14.5M Profit, Bets $35M Against BTC, ETH, and SOL