January 2025 – A detailed technical analysis of the XRP/USD trading pair reveals compelling bullish signals that could propel the digital asset toward a significant price milestone. According to market data and pattern recognition, XRP has completed key technical formations that historically precede substantial upward movements. Consequently, analysts are closely monitoring specific support and resistance levels that may dictate the token’s trajectory in the coming weeks.
XRP Price Prediction: Decoding the Bullish Chart Patterns
The primary driver behind the optimistic XRP price prediction stems from two concurrent technical patterns. Firstly, the daily chart for XRP/USD exhibited a decisive breakout from a falling wedge pattern on January 1, 2025. This pattern, characterized by converging downward-sloping trendlines, typically resolves with a bullish breakout. The validity of this breakout is a critical factor for the forecast. Secondly, market technicians have identified a bull flag pattern forming on the eight-hour chart. This continuation pattern suggests that the recent consolidation phase may be a pause within a larger uptrend, setting the stage for another leg higher.
- Falling Wedge Breakout: A bullish reversal pattern confirmed on the daily timeframe.
- Bull Flag Formation: A continuation pattern observed on the eight-hour chart, indicating sustained buying pressure.
- Key Support: The $2.00 level is now viewed as crucial support for maintaining the bullish structure.
Analyzing the Path to a Potential Rally
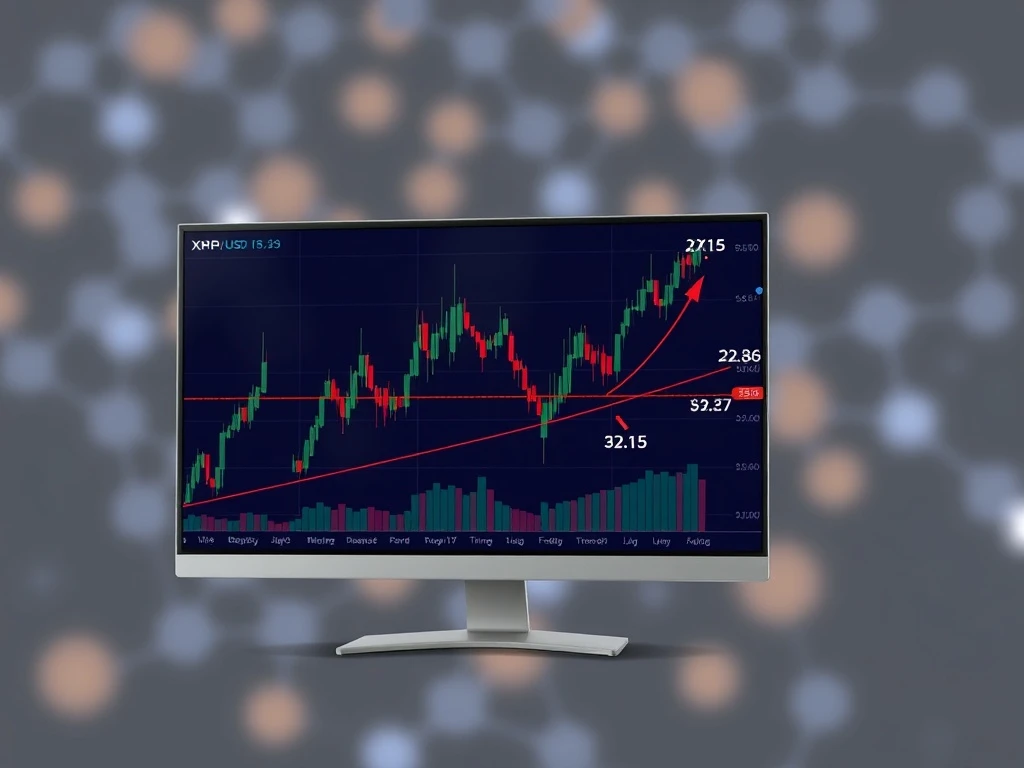
The technical roadmap for XRP outlines specific price levels that traders are watching. Following the falling wedge breakout, the analysis suggests that holding support at the $2.00 psychological level is paramount. If XRP maintains this base, the next logical technical targets reside at $2.40 and then $2.70. Furthermore, the bull flag pattern on the shorter timeframe provides a more immediate signal. A confirmed breakout above the $2.15 resistance level could activate the measured move projection from the flag pattern, which points toward an approximate target of $2.80. Market volume during these potential breakouts will serve as essential confirmation of genuine buyer interest versus a false signal.
Context and Market Dynamics Behind the Analysis
Technical analysis does not exist in a vacuum. This XRP price prediction arrives amid a broader context of regulatory developments and shifting institutional sentiment toward digital assets. The analysis, originally highlighted by Cointelegraph, applies classical charting methodologies used in traditional finance to the cryptocurrency markets. It is crucial to understand that these patterns reflect the collective psychology and actions of market participants. While historical precedent gives these patterns weight, external factors like macroeconomic news, regulatory announcements from bodies like the SEC regarding ongoing litigation, and overall crypto market volatility can immediately alter price trajectories. Therefore, analysts consistently stress that technical targets are projections, not guarantees.
Risk Factors and Technical Caveats
While the indicators point upward, prudent market analysis always considers opposing scenarios. A failure for XRP to hold the $2.00 support level would invalidate the immediate bullish premise and could trigger a retest of lower support zones. Additionally, a breakout from the bull flag pattern that lacks significant trading volume is often considered weak and prone to failure. Traders also monitor the Relative Strength Index (RSI) and other momentum oscillators for signs of overbought conditions that might precede a pullback. The volatile nature of cryptocurrency assets means price can change rapidly, underscoring the importance of risk management alongside any analytical forecast.
Conclusion
In conclusion, the current technical landscape for XRP presents a notably bullish XRP price prediction, with chart patterns aligning to suggest a potential rally toward the $2.80 level. The convergence of a daily falling wedge breakout and an eight-hour bull flag formation provides a structured framework for this outlook. However, the realization of this forecast depends heavily on XRP maintaining key support levels and achieving confirmed breakouts with accompanying volume. As always, investors should synthesize technical analysis with fundamental developments and practice disciplined risk management in the dynamic cryptocurrency market.
FAQs
Q1: What is the main technical reason for the $2.8 XRP price prediction?
The prediction is primarily based on two patterns: a confirmed breakout from a falling wedge on the daily chart and the formation of a bull flag pattern on the eight-hour chart, the latter of which has a measured move target near $2.8.
Q2: What price level is most critical for XRP to hold for this prediction to remain valid?
The $2.00 level is identified as crucial support. A sustained drop below this point could weaken the bullish technical structure and invalidate the short-term prediction for a rally to $2.80.
Q3: How reliable are these chart patterns in cryptocurrency trading?
While chart patterns like wedges and flags are well-established in technical analysis and often used in crypto markets, they are not infallible. Their reliability increases with confirmation from higher trading volume and alignment across multiple timeframes, but they should be used alongside other indicators and fundamental analysis.
Q4: What is a “bull flag” pattern?
A bull flag is a continuation pattern that resembles a flag on a pole. It occurs after a strong price advance (the pole), followed by a period of sideways or slightly downward consolidation (the flag). A breakout above the flag’s upper boundary typically signals a resumption of the prior uptrend.
Q5: Could external events affect this XRP price prediction?
Absolutely. Technical analysis focuses on price action and historical patterns, but cryptocurrency prices are highly sensitive to external factors. Major regulatory news, shifts in broader financial markets, developments in Ripple’s ongoing legal proceedings, or changes in overall crypto market sentiment can rapidly override technical signals.
Related News
- Elizabeth Warren’s Crypto Bill Sparks Controversy: How Regulatory Tweaks Could Favor Wall Street Giants
- CLARITY Act Faces Crucial Delay: Senators Remain Optimistic Despite Coinbase Opposition
- Goldman Sachs Pioneers Strategic Expansion into Asset Tokenization and Prediction Markets for 2025 Growth