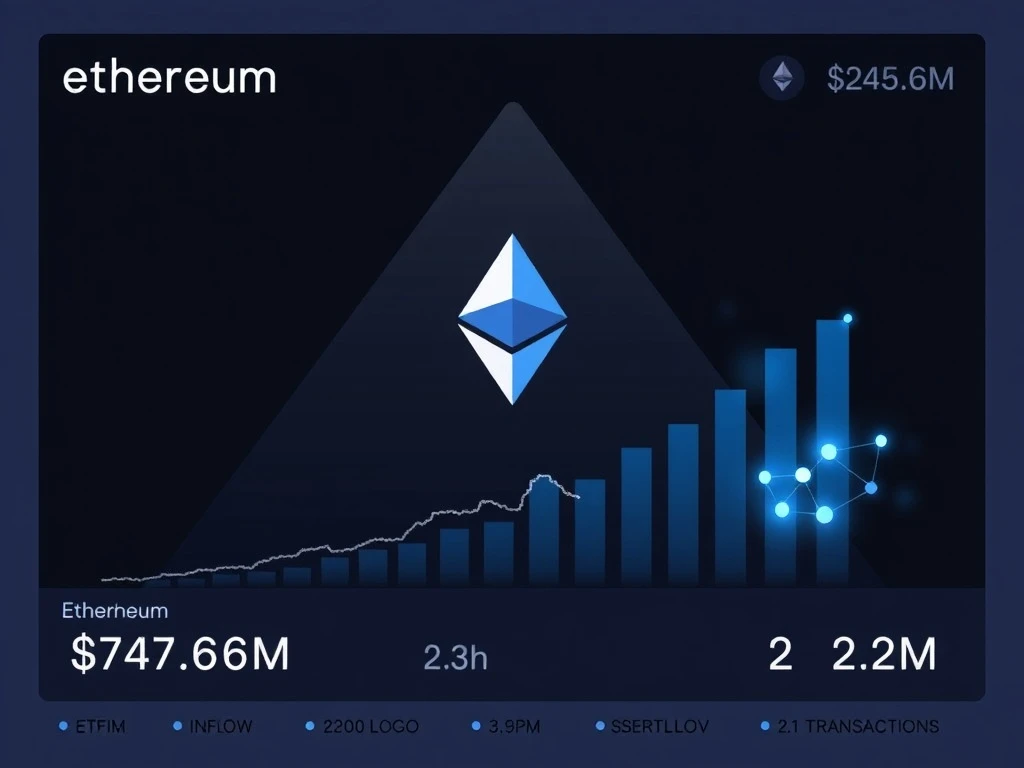
Institutional demand for Ethereum reached a pivotal milestone this week as ETH spot ETF buying dramatically outpaced new supply, signaling a fundamental shift in market dynamics that could reshape cryptocurrency adoption patterns through 2025. According to data from Farside Investors reported by Cointelegraph, U.S. spot Ethereum ETFs recorded approximately $474.6 million in net inflows during the week ending January 20, 2025, surpassing the cryptocurrency’s newly minted supply and creating unprecedented buying pressure. This development occurs alongside remarkable on-chain activity, with daily Ethereum transactions reaching a new all-time high of 2.9 million on January 16, while active addresses surged 53% month-over-month.
ETH Spot ETF Inflows Create Supply Shock
The $474.6 million in weekly net inflows into U.S. spot Ethereum ETFs represents a significant acceleration in institutional adoption that began with regulatory approval in late 2024. These investment vehicles, which directly hold Ethereum tokens, have created a new demand channel that now exceeds the network’s daily issuance rate. Consequently, this imbalance between institutional buying pressure and new supply creates what market analysts term a “supply shock” scenario. Historically, similar dynamics in Bitcoin markets preceded substantial price appreciation periods when ETF demand consistently outpaced miner selling and new coin creation.
Market structure analysis reveals several critical factors driving this trend:
- Institutional Portfolio Allocation: Traditional finance firms are increasing ETH exposure as digital asset allocation becomes standard practice
- Regulatory Clarity: Clearer cryptocurrency frameworks in 2024-2025 have reduced institutional hesitation
- Yield Generation Strategies: Ethereum’s staking mechanism provides institutional investors with additional revenue streams
- Diversification Benefits: Portfolio managers view ETH as complementary to Bitcoin rather than competitive
| Metric | Weekly Value | Significance |
|---|---|---|
| ETF Net Inflows | $474.6 million | Exceeds daily new ETH supply |
| Daily Transactions | 2.9 million (ATH) | Network utility at record levels |
| Active Address Growth | 53% month-over-month | User adoption accelerating |
| Supply Inflation Rate | ~0.25% annually | Post-merge issuance minimal |
On-Chain Metrics Confirm Institutional Accumulation
Blockchain analytics provide compelling evidence supporting the ETF inflow data, with multiple on-chain indicators confirming substantial accumulation patterns. The 53% month-over-month increase in active Ethereum addresses represents the most significant expansion since the 2021 bull market, suggesting both retail and institutional participation is growing simultaneously. Furthermore, the record 2.9 million daily transactions on January 16 demonstrates unprecedented network utility, with decentralized finance protocols, non-fungible token marketplaces, and layer-2 scaling solutions all contributing to heightened activity.
Exchange flow data reveals complementary trends that strengthen the institutional accumulation thesis. Throughout January 2025, net outflows from centralized exchanges have consistently exceeded inflows, indicating that more Ethereum is moving to cold storage and institutional custody solutions than is being deposited for potential selling. This pattern typically precedes reduced selling pressure as coins become less liquid. Additionally, the percentage of ETH supply held in smart contracts has reached new highs, suggesting long-term holding behavior rather than speculative trading.
Technical Analysis Perspective: Symmetrical Triangle Formation
From a chart analysis standpoint, Ethereum is forming a symmetrical triangle pattern on its daily timeframe, according to technical analysts cited by Cointelegraph. This consolidation pattern typically resolves with a decisive breakout in either direction, with the current setup suggesting potential upward momentum given the fundamental backdrop of strong ETF inflows and supply constraints. The pattern’s upper resistance line currently sits near $3,800, while support holds around $3,200, creating a narrowing range that market participants expect to resolve in the coming weeks.
A successful breakout above the triangle’s resistance could propel ETH toward the $4,500 level, representing approximately 25% upside from current levels. Should buying pressure continue and institutional demand persist, some analysts project a further rally toward $5,500 based on Fibonacci extension levels and previous resistance zones. However, technical analysts emphasize that breakouts require confirmation through sustained volume and price action above key levels, with false breakouts remaining a possibility in volatile cryptocurrency markets.
Historical Context and Market Implications
The current situation with ETH spot ETF buying outpacing new supply mirrors patterns observed in Bitcoin markets following the introduction of U.S. spot Bitcoin ETFs in January 2024. Historical data shows that when ETF demand consistently exceeds new coin creation, significant price appreciation typically follows as available supply diminishes relative to demand. The Ethereum network’s transition to proof-of-stake in 2022 reduced new issuance by approximately 90%, making the supply side particularly inelastic and potentially amplifying the impact of institutional inflows.
Market implications extend beyond price action to broader ecosystem development:
- Validator Economics: Increased institutional staking could further decentralize network security
- Developer Activity: Positive price momentum often correlates with increased protocol development
- Regulatory Attention: Success of ETH ETFs may influence cryptocurrency policy decisions
- Competitive Positioning: Ethereum’s market position relative to alternative layer-1 networks
Conclusion
The phenomenon of ETH spot ETF buying outpacing new supply represents a fundamental market shift with potentially far-reaching implications for cryptocurrency adoption and price discovery mechanisms. With $474.6 million in weekly inflows, record transaction activity, and accelerating address growth, Ethereum demonstrates robust fundamentals that extend beyond speculative trading. The symmetrical triangle formation on technical charts suggests an impending volatility expansion that could resolve upward given the supportive institutional demand backdrop. As traditional finance continues integrating digital assets through regulated vehicles like spot ETFs, the supply-demand dynamics observed this week may establish a new paradigm for cryptocurrency market structure through 2025 and beyond.
FAQs
Q1: What does it mean that ETH spot ETF buying outpaces new supply?
A1: This means institutional investors purchasing Ethereum through exchange-traded funds are acquiring more ETH than the network creates through its proof-of-stake issuance mechanism, creating net buying pressure that reduces available supply.
Q2: How significant is the $474.6 million in weekly ETF inflows?
A2: The $474.6 million represents substantial institutional demand, exceeding typical weekly inflows for most new financial products and indicating serious capital allocation to Ethereum by traditional finance participants.
Q3: What is a symmetrical triangle pattern in technical analysis?
A3: A symmetrical triangle is a chart pattern where price oscillates between converging trendlines, typically indicating consolidation before a decisive breakout. The pattern suggests market participants are uncertain about direction but preparing for increased volatility.
Q4: How does increased institutional ETF buying affect ordinary Ethereum investors?
A4: Institutional buying through ETFs generally reduces circulating supply, potentially supporting prices, but may also increase correlation with traditional markets and reduce volatility as larger, more conservative investors enter the market.
Q5: What factors could reverse the current trend of ETF inflows outpacing supply?
A5: Potential reversal factors include regulatory changes affecting ETF operations, significant Ethereum protocol issues, broader financial market downturns reducing risk appetite, or substantial selling by early investors and foundations that offsets ETF buying.
Related News
- Bitcoin Miner Canaan Confronts Critical Nasdaq Delisting Threat Over Sub-$1 Share Price Crisis
- Hardware Wallet Scandal: ZachXBT Exposes $282M Theft That Fueled Monero’s Alarming Surge
- Ether Surges as Crypto Funds Celebrate Fourth Consecutive Green Day Amid Institutional Revival