Ethereum faces significant downward pressure as technical analysts identify a concerning bear flag pattern that could potentially drive ETH prices toward the $1,850 level, according to recent market observations and expert analysis. This development follows Ethereum’s decisive break below the crucial $3,000 psychological support level, triggering renewed concerns among traders and investors about the cryptocurrency’s near-term trajectory. Market participants now closely monitor key support zones and on-chain metrics for signals about Ethereum’s next directional move in the increasingly volatile cryptocurrency landscape of 2025.
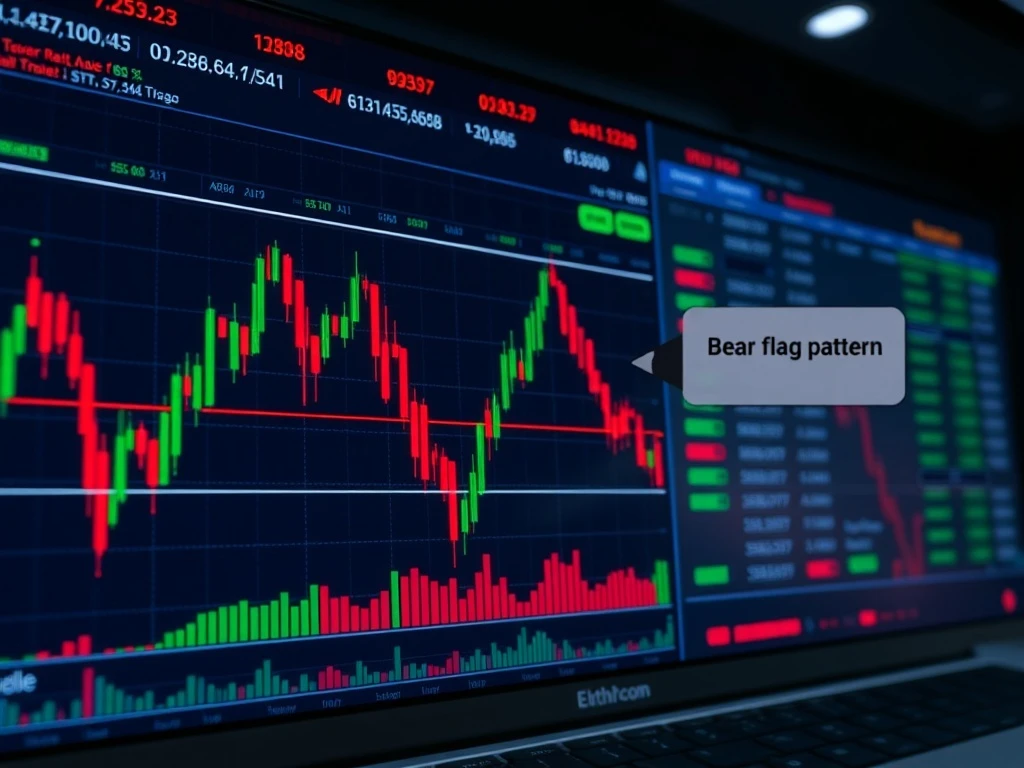
Understanding Ethereum’s Bear Flag Pattern Formation
Technical analysts have identified what they describe as a classic bear flag pattern in Ethereum’s price chart. This pattern typically forms after a significant downward move, followed by a period of consolidation that resembles a flag on a pole. The consolidation phase often represents a temporary pause before the continuation of the prior downtrend. Ethereum’s bear flag emerged following its break below the $3,000 support level, which previously served as a critical psychological and technical barrier for the cryptocurrency.
Market technicians measure bear flag patterns by projecting the length of the initial decline, known as the flagpole, from the breakout point of the consolidation pattern. According to this methodology, Ethereum’s current formation suggests a potential price target around $1,850. This technical projection aligns with historical support levels and Fibonacci retracement zones that have previously influenced Ethereum’s price action during previous market cycles.
Key Support Levels and On-Chain Analysis
On-chain analyst Kriptoholder has identified significant buy walls in Ethereum’s order book that could potentially slow or temporarily halt the cryptocurrency’s descent. The most immediate support cluster exists between $2,800 and $2,850, where substantial buying interest appears concentrated. Another critical support zone resides between $2,500 and $2,600, which coincidentally aligns with Ethereum’s 200-day moving average—a widely watched long-term trend indicator.
These support levels represent areas where market participants have historically shown increased buying interest. The 200-day moving average specifically serves as a crucial technical benchmark that often determines the overall market sentiment toward an asset. A sustained break below this level would likely signal a more profound shift in Ethereum’s market structure and potentially accelerate selling pressure.
Market Context and Historical Precedents
Ethereum’s current technical setup occurs within a broader cryptocurrency market context characterized by regulatory developments, institutional adoption trends, and macroeconomic factors influencing digital asset valuations. Historical analysis reveals that bear flag patterns have frequently preceded significant price movements in both traditional financial markets and cryptocurrency ecosystems.
The cryptocurrency market’s 2025 landscape differs substantially from previous cycles due to increased institutional participation, more sophisticated derivatives markets, and evolving regulatory frameworks. These factors potentially amplify both the risks and opportunities associated with technical patterns like the current bear flag formation. Market participants must consider these contextual elements when interpreting technical signals and making trading decisions.
Analyst Perspectives and Market Sentiment
Multiple analysts have contributed insights regarding Ethereum’s current technical position. Their collective observations highlight the importance of monitoring both technical patterns and fundamental developments simultaneously. While technical analysis provides valuable insights into potential price trajectories, it represents just one component of comprehensive market assessment.
Market sentiment indicators currently reflect increased caution among Ethereum traders and investors. Options market data shows growing demand for downside protection, while funding rates in perpetual swap markets have normalized from previously elevated levels. These metrics suggest that market participants are positioning for potential volatility while maintaining awareness of both bullish and bearish scenarios.
Risk Management Considerations
Professional traders emphasize the importance of risk management when navigating potential bear flag scenarios. Technical patterns provide probabilistic outcomes rather than certain predictions. Market participants typically employ multiple confirmation signals before acting on pattern-based forecasts. These confirmations might include volume analysis, momentum indicators, and breaks of additional support levels beyond the initial pattern formation.
The cryptocurrency market’s inherent volatility necessitates careful position sizing and stop-loss placement, particularly when trading based on technical patterns. Experienced market participants often wait for pattern confirmation through decisive price action rather than anticipating moves before they materialize. This disciplined approach helps mitigate risks associated with false signals and premature entries.
Broader Cryptocurrency Market Implications
Ethereum’s technical developments carry implications for the broader cryptocurrency ecosystem. As the second-largest cryptocurrency by market capitalization, Ethereum often influences sentiment across alternative cryptocurrencies and decentralized finance protocols. A sustained decline in Ethereum’s price could potentially create ripple effects throughout related sectors and projects.
However, market correlations between cryptocurrencies have shown variability in recent years, with some assets demonstrating increased independence during specific market phases. This evolving dynamic means that Ethereum’s technical patterns may not necessarily dictate movements across all digital assets. Market participants must analyze each cryptocurrency’s unique fundamentals alongside broader market trends.
Fundamental Developments and Network Activity
Beyond technical patterns, Ethereum’s fundamental metrics continue evolving. Network activity, transaction volumes, decentralized application usage, and staking dynamics all contribute to Ethereum’s long-term value proposition. These fundamental factors sometimes diverge from short-term technical patterns, creating potential disconnects between price action and underlying network health.
Ethereum’s ongoing development roadmap includes significant upgrades and improvements that could influence market perceptions and valuations. These technological advancements represent important considerations for long-term investors who base decisions on fundamental network characteristics rather than short-term technical patterns alone.
Conclusion
Ethereum’s bear flag pattern presents a concerning technical development that suggests potential downside toward the $1,850 level, according to analyst observations. The cryptocurrency’s break below $3,000 support triggered this pattern formation, with key support levels now being tested at $2,800-$2,850 and $2,500-$2,600. While technical patterns provide valuable insights, market participants must consider them alongside fundamental developments, broader market context, and proper risk management practices. Ethereum’s price action in coming weeks will determine whether this bear flag pattern confirms or invalidates, potentially shaping cryptocurrency market sentiment throughout 2025.
FAQs
Q1: What is a bear flag pattern in technical analysis?
A bear flag pattern is a technical chart formation that typically occurs after a sharp downward price movement. It consists of a consolidation period that slopes slightly upward or moves sideways, resembling a flag, followed by a continuation of the downtrend. Technical analysts use this pattern to identify potential further declines in asset prices.
Q2: How reliable are bear flag patterns for predicting price movements?
Bear flag patterns, like all technical formations, provide probabilistic outcomes rather than certain predictions. Their reliability depends on proper identification, confirmation through volume and momentum indicators, and broader market context. Experienced traders typically wait for pattern confirmation through decisive price breaks before acting on these signals.
Q3: What are the key support levels for Ethereum mentioned by analysts?
Analysts have identified two primary support clusters for Ethereum. The first exists between $2,800 and $2,850, where significant buy orders appear concentrated. The second support zone ranges from $2,500 to $2,600, which aligns with Ethereum’s 200-day moving average—a crucial long-term trend indicator.
Q4: How does the 200-day moving average influence cryptocurrency prices?
The 200-day moving average represents the average closing price of an asset over the previous 200 trading days. Many traders and investors view this indicator as a benchmark for long-term trends. Prices above the 200-day moving average often signal bullish conditions, while sustained breaks below may indicate bearish momentum.
Q5: Should investors be concerned about Ethereum’s long-term prospects based on this technical pattern?
Short-term technical patterns like bear flags typically reflect near-term market sentiment rather than long-term fundamentals. While concerning for traders focused on shorter timeframes, long-term investors generally consider fundamental factors like network development, adoption metrics, and technological advancements alongside technical patterns when making investment decisions.
Related News
- Crypto Futures Liquidations Unleash $115M Storm as ETH and BTC Longs Face Brutal 24-Hour Squeeze
- Bank of Japan Holds Steady: Crucial 0.75% Rate Decision Defies Global Pressure
- Ripple’s Strategic Masterstroke: Expanding Into Core Banking Through DXC’s $5 Trillion Platform