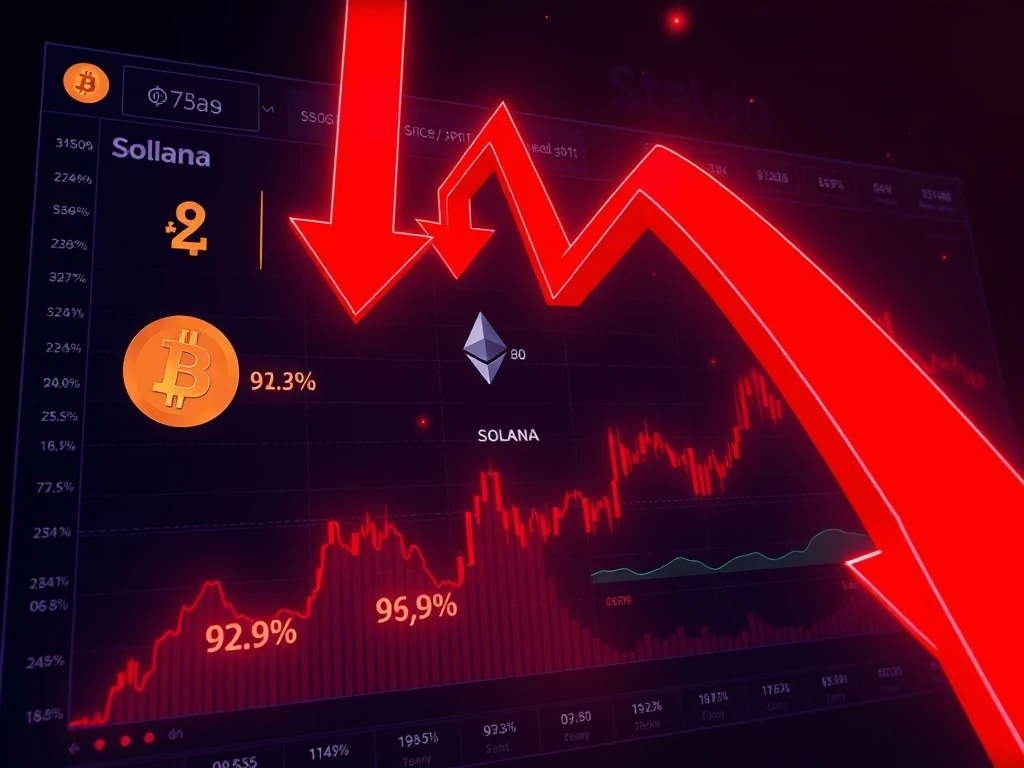
Global cryptocurrency markets experienced a significant liquidation event on March 15, 2025, with approximately $478 million in forced position closures across major trading platforms. This substantial market movement revealed a striking pattern: long positions overwhelmingly dominated the liquidations, particularly affecting Bitcoin, Ethereum, and Solana traders. Market analysts immediately noted the unusual concentration of long position liquidations, which accounted for more than 90% of total forced closures across these major assets. Consequently, this event provides crucial insights into current market leverage, trader positioning, and potential volatility triggers in the evolving cryptocurrency landscape.
Crypto Liquidation Event Analysis: The $478M Market Reset
The cryptocurrency perpetual futures market witnessed forced liquidations totaling $478 million over a critical 24-hour period. Significantly, this event highlighted extreme leverage conditions and concentrated directional bets across major digital assets. Market data reveals that long positions—bets on price increases—faced disproportionate pressure during this market correction. Furthermore, the concentration of liquidations in long positions suggests that many traders entered the market with excessive optimism and insufficient risk management protocols. Historical context shows similar patterns during previous market corrections, though the magnitude of long dominance in this event stands out as particularly noteworthy for 2025 market conditions.
Perpetual futures contracts, which lack expiration dates and use funding mechanisms to maintain price alignment with spot markets, have become increasingly popular trading instruments. These instruments enable traders to employ significant leverage, often ranging from 5x to 100x their initial capital. However, this leverage amplifies both potential profits and risks, creating conditions ripe for cascading liquidations during volatile price movements. Market infrastructure, including exchange risk engines and liquidation protocols, played a crucial role in managing this event without causing broader systemic issues. Additionally, regulatory developments in 2024 and early 2025 have influenced margin requirements and risk parameters across major trading platforms.
Bitcoin Liquidations: $196M With 93.88% Long Dominance
Bitcoin, the largest cryptocurrency by market capitalization, experienced $196 million in liquidations during this event. Remarkably, long positions accounted for 93.88% of these forced closures, indicating widespread over-leveraged bullish positioning. This concentration suggests that many traders anticipated continued price appreciation despite emerging market headwinds. Technical analysis reveals that Bitcoin’s price decline triggered liquidation cascades as successive long positions reached their margin thresholds. Market microstructure data shows that most liquidations occurred across major exchanges including Binance, Bybit, and OKX, with Asian trading hours seeing particularly intense activity.
The Bitcoin derivatives market has grown substantially since 2023, with open interest regularly exceeding $20 billion across global platforms. This growth has increased the potential impact of liquidation events on overall market stability. Historical comparison reveals that the 93.88% long liquidation ratio represents one of the most skewed distributions in recent Bitcoin market history. Market participants note that such extreme ratios often precede periods of consolidation or trend reversals as excessive leverage gets cleared from the system. Institutional positioning data from Q1 2025 indicates that while retail traders dominated long liquidations, institutional players maintained more balanced exposure through sophisticated hedging strategies.
Market Mechanism Insights: How Liquidations Cascade
Liquidation events follow specific mechanical processes within cryptocurrency exchanges. When a trader’s position loses value and approaches the maintenance margin level, exchanges issue margin calls. If additional collateral isn’t provided, the exchange automatically closes the position to prevent negative balances. During rapid price movements, these liquidations can create cascading effects as forced selling pushes prices lower, triggering additional liquidations. Exchange risk engines employ various mechanisms to manage this process, including partial liquidations, auto-deleveraging systems, and insurance funds. The March 2025 event tested these systems under significant pressure, with most major exchanges reporting successful management without requiring socialized loss mechanisms.
Ethereum Market Impact: $219M With 92.9% Long Liquidations
Ethereum faced $219 million in liquidations, slightly exceeding Bitcoin’s total despite its smaller market capitalization. The 92.9% long position dominance in Ethereum liquidations reflects similar over-leveraged bullish sentiment across the second-largest cryptocurrency. This substantial liquidation volume occurred amid ongoing Ethereum network developments, including continued Layer 2 expansion and preparations for upcoming protocol upgrades. Derivatives market data reveals that Ethereum perpetual futures have gained popularity relative to Bitcoin in early 2025, potentially explaining the higher absolute liquidation volume despite Ethereum’s smaller overall market size.
Ethereum’s derivatives market structure exhibits unique characteristics compared to Bitcoin. Notably, Ethereum options markets have shown increased activity since 2024, providing additional hedging instruments for sophisticated traders. However, the perpetual futures market remains the dominant venue for leveraged speculation. The 92.9% long liquidation ratio suggests that Ethereum traders exhibited even more concentrated directional bias than Bitcoin traders during this period. Market analysts point to several potential factors including anticipation of Ethereum ETF developments, Layer 2 adoption metrics, and DeFi protocol growth projections that may have influenced this bullish positioning.
Key factors influencing Ethereum’s liquidation dynamics:
- Increased institutional interest in Ethereum derivatives throughout 2024
- Growing correlation between Ethereum and broader altcoin markets
- Technical support levels that failed to hold during the decline
- Funding rate adjustments that preceded the liquidation event
Solana Liquidations: Extreme 96.6% Long Position Dominance
Solana experienced the most extreme long position concentration among major assets, with 96.6% of its $63.04 million in liquidations affecting bullish bets. This exceptionally high percentage highlights the speculative positioning surrounding Solana amid its rapid ecosystem growth and price appreciation throughout 2024. The asset’s historical volatility and recent performance likely attracted traders employing high leverage to amplify potential returns. Market data indicates that Solana’s derivatives markets have grown disproportionately to its spot market volume, creating conditions where liquidation events can have amplified price impacts relative to market capitalization.
Solana’s market structure presents unique characteristics that influenced this liquidation event. The asset has demonstrated higher beta relative to Bitcoin and Ethereum, meaning it typically experiences more pronounced price movements during market corrections. This characteristic, combined with growing derivatives market participation, created conditions for extreme long liquidation ratios. Exchange-specific data reveals that Solana liquidations were concentrated on platforms popular with retail traders, suggesting that this demographic bore the brunt of the forced position closures. The 96.6% figure represents one of the most skewed long/short liquidation ratios recorded for any major cryptocurrency in 2025.
Expert Analysis: Risk Management Perspectives
Market analysts emphasize several crucial risk management lessons from this liquidation event. First, position sizing and leverage management remain fundamental to sustainable trading strategies. Second, diversification across timeframes and instruments can mitigate concentration risk during volatility events. Third, understanding exchange-specific liquidation mechanisms and insurance fund adequacy provides important context for platform selection. Fourth, monitoring funding rates and open interest trends offers early warning signals for potential liquidation cascades. Industry experts with derivatives trading experience note that events like these typically reset market leverage to healthier levels, though they can create short-term dislocations and trading opportunities for prepared participants.
Market Context and Historical Comparisons
The March 2025 liquidation event occurs within a broader market context of increasing cryptocurrency derivatives adoption and evolving regulatory frameworks. Historical analysis reveals similar patterns during previous market cycles, though the scale and concentration of long liquidations in this event stand out. Comparable events in 2021 and 2023 featured different long/short ratios and total volumes, reflecting evolving market structures and participant behaviors. The growth of institutional participation since 2023 has altered market dynamics, though retail traders still dominate leveraged positions on many platforms. Regulatory developments in key jurisdictions including the United States, European Union, and Asia have implemented stricter leverage limits and risk disclosure requirements that influenced 2025 market conditions.
Market infrastructure has evolved significantly since previous major liquidation events. Exchanges have implemented more sophisticated risk management systems, increased insurance fund sizes, and developed partial liquidation mechanisms to reduce market impact. These improvements likely prevented more severe cascading effects during the March 2025 event. However, the concentration of liquidations in long positions across multiple assets suggests that market sentiment had become excessively bullish relative to fundamental developments. Technical indicators including funding rates, open interest trends, and options skew had signaled elevated risk conditions in the weeks preceding the liquidation event, though many traders apparently disregarded these warning signals.
Conclusion
The $478 million crypto liquidation event provides crucial insights into current market dynamics and trader positioning. The overwhelming dominance of long positions across Bitcoin, Ethereum, and Solana liquidations reveals concentrated bullish sentiment and potentially excessive leverage in cryptocurrency derivatives markets. This crypto liquidation event serves as a reminder of the risks inherent in leveraged trading and the importance of robust risk management protocols. Market participants should carefully analyze the lessons from this event as cryptocurrency derivatives continue evolving in sophistication and scale. Ultimately, such liquidation events typically reset market leverage to healthier levels while providing valuable data about sentiment extremes and potential turning points in market cycles.
FAQs
Q1: What causes cryptocurrency liquidation events?
Liquidation events occur when traders’ leveraged positions lose sufficient value to trigger automatic closures by exchanges. These events typically happen during rapid price movements when positions fall below maintenance margin requirements, forcing exchanges to sell collateral to prevent losses.
Q2: Why were long positions so dominant in this liquidation event?
Long positions dominated because market sentiment had become excessively bullish, with many traders employing high leverage to bet on price increases. When prices declined instead, these over-leveraged long positions reached their liquidation thresholds before short positions.
Q3: How do exchanges manage liquidation cascades?
Exchanges use sophisticated risk engines that employ partial liquidations, insurance funds, and auto-deleveraging mechanisms. These systems aim to manage liquidations efficiently while minimizing market impact and preventing systemic issues across their platforms.
Q4: What is the difference between perpetual futures and traditional futures?
Perpetual futures lack expiration dates and use funding mechanisms to maintain price alignment with spot markets. Traditional futures have set expiration dates and settle based on predetermined settlement processes at contract maturity.
Q5: How can traders protect against liquidation risks?
Traders can employ prudent risk management including appropriate position sizing, diversified exposure, stop-loss orders, and careful leverage selection. Monitoring funding rates, open interest trends, and market sentiment indicators also provides early warning signals for potential volatility events.
Related News
- Upbit Lawsuit Dismissal: Court Delivers Crucial Ruling on Crypto Exchange Liability During Martial Law Crisis
- BTC Perpetual Futures Reveal Alarming Short Dominance Across Top Crypto Exchanges
- FCA Crypto Regulations: Critical Final Consultation Launches with 10 Transformative Proposals