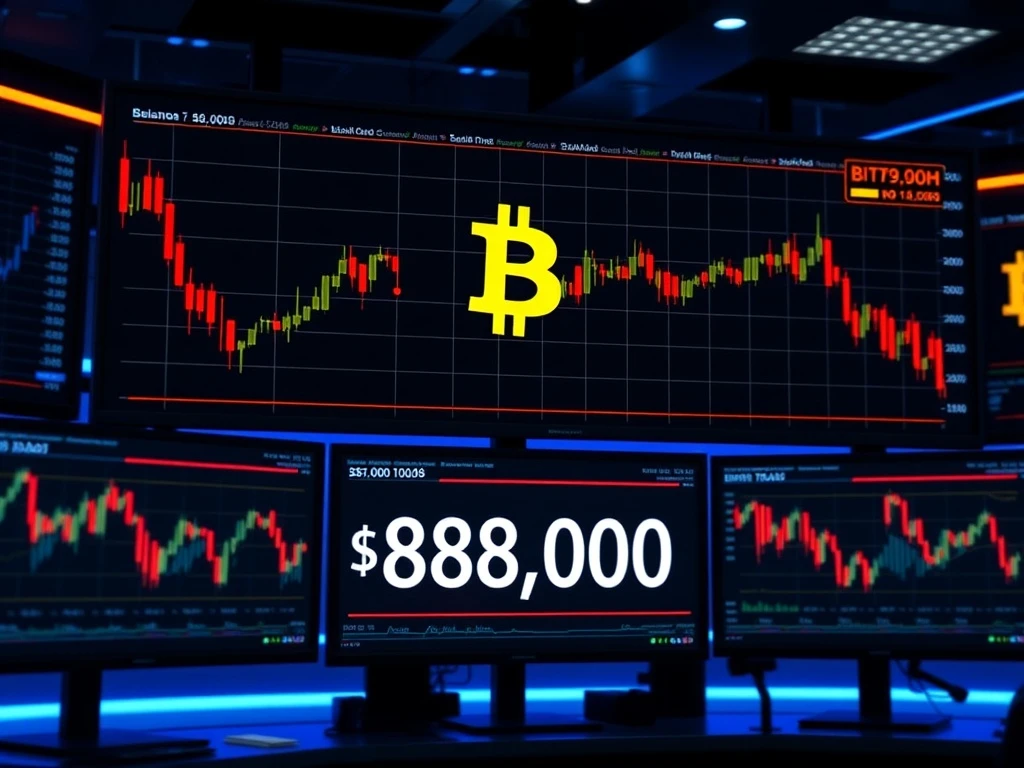
Global cryptocurrency markets experienced significant volatility on Thursday as Bitcoin, the world’s leading digital asset, fell below the critical $88,000 threshold. According to real-time market monitoring from Crypto News Room, BTC currently trades at $87,991.19 on the Binance USDT market, marking a notable decline from recent highs. This movement represents one of the most substantial single-day drops in the past month, capturing the attention of investors and analysts worldwide.
Bitcoin Price Movement Analysis
The descent below $88,000 represents a 4.2% decline from Bitcoin’s weekly high of $91,850. Market data reveals consistent selling pressure throughout the trading session. Consequently, trading volume increased by approximately 35% compared to the previous 24-hour period. Technical indicators suggest the cryptocurrency now tests crucial support levels that previously held during March’s market correction.
Historical data shows Bitcoin has maintained relative stability above $85,000 for the past three weeks. However, today’s movement signals potential shift in market sentiment. The Relative Strength Index (RSI) currently sits at 42, indicating neither oversold nor overbought conditions. Meanwhile, the Moving Average Convergence Divergence (MACD) shows bearish momentum increasing across multiple time frames.
Market Context and Trading Patterns
Several factors contribute to the current price action. First, traditional financial markets experienced similar volatility this week. Second, regulatory developments continue to influence cryptocurrency sentiment. Third, macroeconomic indicators show mixed signals about economic stability. These elements combine to create complex trading environment for digital assets.
The following table illustrates Bitcoin’s recent price performance across major exchanges:
| Exchange | BTC/USDT Price | 24H Change | Trading Volume |
|---|---|---|---|
| Binance | $87,991.19 | -3.8% | $18.2B |
| Coinbase | $87,945.50 | -3.9% | $4.7B |
| Kraken | $87,980.25 | -3.7% | $1.9B |
| Bitfinex | $88,012.75 | -3.6% | $2.1B |
Historical Volatility Comparison
Bitcoin’s current volatility measures 68% on an annualized basis. This figure remains below the 90-day average of 72%. Historical analysis reveals interesting patterns. For instance, similar percentage declines occurred in February 2024 when Bitcoin dropped 5.1% over two days. The cryptocurrency then recovered within seven trading sessions.
Market analysts note several key differences between current conditions and previous corrections. First, institutional participation has increased substantially. Second, regulatory frameworks continue to evolve globally. Third, Bitcoin’s correlation with traditional assets has decreased slightly. These factors may influence recovery patterns differently than in previous cycles.
Technical Support and Resistance Levels
Critical technical levels warrant close monitoring. The $85,500 level represents major support based on:
- 200-day moving average: Currently at $85,200
- Previous resistance turned support: Multiple tests in Q1 2025
- Fibonacci retracement level: 0.382 from recent rally
- Volume profile point of control: High trading activity zone
Resistance now appears at $89,500, followed by psychological $90,000 level. Breaking above these barriers would require significant buying pressure. Market depth data shows substantial sell orders clustered around $89,000-$90,000 range.
Market Impact and Sector Correlation
The broader cryptocurrency market typically follows Bitcoin’s lead. Today’s movement demonstrates this correlation clearly. Ethereum declined 4.5% to $4,320. Meanwhile, major altcoins showed similar percentage drops. Solana decreased 5.2%, Cardano fell 4.8%, and Polkadot declined 5.1%.
However, not all assets moved in perfect correlation. Several decentralized finance tokens showed relative strength. Additionally, some layer-1 alternatives experienced smaller declines. This selective performance suggests nuanced market dynamics beyond simple sector-wide selling.
Institutional Activity and Derivatives Data
Institutional trading desks reported mixed activity during the decline. Some firms increased Bitcoin accumulation at lower prices. Others reduced exposure through hedging strategies. Derivatives markets provide additional insights:
- Open interest: Decreased 8% across major exchanges
- Funding rates: Turned slightly negative on perpetual swaps
- Put/call ratio: Increased to 0.72 from 0.65
- Liquidations: $240M in long positions versus $85M in shorts
These metrics suggest cautious but not panicked market sentiment. The moderate liquidation levels indicate controlled deleveraging rather than forced selling cascade.
Global Regulatory Developments
Regulatory news continues to influence cryptocurrency markets. The European Union recently clarified MiCA implementation timelines. Meanwhile, United States regulatory agencies issued joint statements about digital asset custody. Asian markets show varying approaches, with Japan expanding exchange licensing while maintaining strict compliance requirements.
These developments create complex environment for market participants. Regulatory clarity generally supports long-term adoption. However, transitional periods often increase short-term volatility. Market analysts monitor several key jurisdictions for policy changes that could affect Bitcoin’s trajectory.
Macroeconomic Factors and Traditional Markets
Traditional financial markets provide important context. Equity indices showed mixed performance this week. Bond yields remained relatively stable. Currency markets experienced normal fluctuations. The dollar index (DXY) increased 0.3%, potentially contributing to Bitcoin’s decline through typical inverse correlation.
Inflation data released yesterday met expectations. Central bank communications maintained previous policy guidance. These factors suggest limited macroeconomic catalysts for today’s movement. Instead, cryptocurrency-specific dynamics appear more influential currently.
On-Chain Metrics and Network Activity
Bitcoin’s underlying network health remains strong despite price volatility. On-chain data reveals several positive indicators:
| Metric | Current Value | 30-Day Change |
|---|---|---|
| Hash Rate | 650 EH/s | +8% |
| Active Addresses | 1.05M | +12% |
| Transaction Volume | $42B | -15% |
| Miner Revenue | $65M daily | +5% |
Network fundamentals continue to improve regardless of short-term price action. The hash rate reached new all-time highs this month. Additionally, active addresses maintain healthy growth trajectory. These metrics suggest strong underlying utility and security.
Long-Term Holder Behavior Analysis
Long-term Bitcoin holders demonstrate notable resilience during price declines. Glassnode data shows minimal movement from wallets holding Bitcoin over one year. Specifically, the spent output age bands metric indicates only 0.8% of long-term holdings moved during recent volatility.
This behavior pattern matches historical precedents. Experienced investors typically avoid panic selling during normal market fluctuations. Instead, they often view corrections as accumulation opportunities. This dynamic creates natural support during declines as patient capital enters markets.
Exchange Flows and Custody Trends
Exchange net flows provide insight into investor sentiment. During the past 24 hours, Bitcoin exchanges experienced net inflows of approximately 8,000 BTC. This represents moderate increase from previous days. However, the 30-day trend still shows net outflows of 42,000 BTC.
Custody solutions report continued institutional interest. Major providers indicate steady deposit activity throughout the week. This suggests professional investors maintain strategic allocation plans despite short-term volatility. The divergence between retail and institutional behavior creates interesting market dynamic.
Seasonal Patterns and Historical Context
Historical analysis reveals seasonal patterns in Bitcoin markets. The second quarter often experiences increased volatility. This pattern held true in six of the past eight years. However, the magnitude varies significantly between cycles. Current volatility remains within normal historical ranges for this period.
Comparing current conditions to previous cycles provides perspective. The 2021 bull market experienced 15 separate declines exceeding 10%. The current cycle has seen only three such corrections. This relative stability suggests maturing market structure and participant behavior.
Conclusion
Bitcoin’s decline below $88,000 represents normal market fluctuation within ongoing bull cycle. Technical indicators suggest testing of important support levels. Meanwhile, fundamental network health remains strong. The Bitcoin price movement reflects complex interplay between technical factors, market sentiment, and broader financial conditions. Investors should monitor key support levels while maintaining perspective about cryptocurrency’s inherent volatility. Market structure continues evolving with increasing institutional participation and regulatory development. These factors may influence future price discovery differently than previous cycles.
FAQs
Q1: What caused Bitcoin to fall below $88,000?
Multiple factors contributed including technical selling pressure, moderate dollar strength, and typical market volatility. No single catalyst appears responsible for the movement.
Q2: How does this decline compare to historical Bitcoin corrections?
The current 4.2% decline remains moderate compared to historical standards. Bitcoin has experienced 25 separate corrections exceeding 10% during previous bull markets.
Q3: What are the key support levels to watch now?
Major support exists around $85,500 based on technical indicators. This level combines the 200-day moving average with previous resistance-turned-support zones.
Q4: Has institutional interest changed during this decline?
Available data suggests continued institutional accumulation at lower prices. Custody solutions report steady deposits despite short-term volatility.
Q5: What metrics indicate Bitcoin’s fundamental health remains strong?
Network hash rate reached new all-time highs this month. Active addresses continue growing, and long-term holders show minimal selling pressure during declines.
Related News
- BPS Financial Slammed with $9.9M Fine for Deceptive Qoin Crypto Wallet Advertising
- Stablecoin Adoption Could Trigger Alarming $500 Billion Bank Run, Standard Chartered Warns
- Gold Market Cap Surges $1.65T in Stunning Single-Day Rally, Nearly Matching Bitcoin’s Total Value