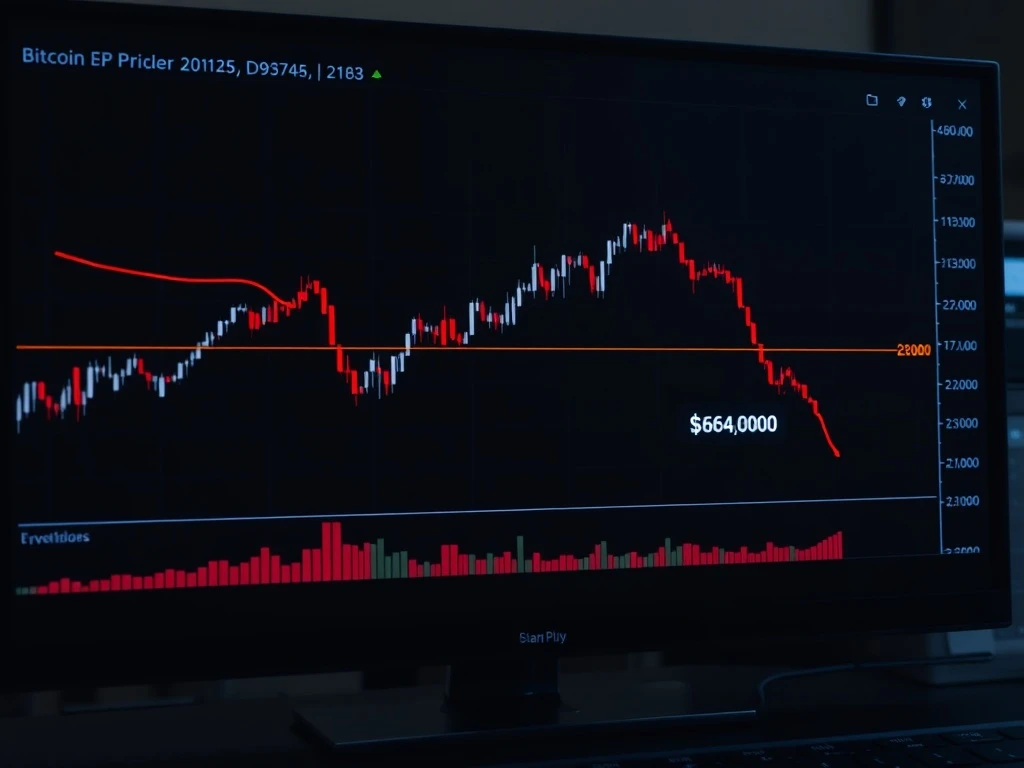
Global cryptocurrency markets experienced significant volatility today as Bitcoin, the world’s leading digital asset, dropped below the crucial $64,000 threshold. According to real-time data from Crypto News Room market monitoring, BTC is currently trading at $63,962.6 on the Binance USDT market. This movement represents a notable shift in market sentiment that warrants careful examination. Consequently, investors and analysts are scrutinizing multiple factors behind this price action. Market participants globally are assessing the implications of this decline.
Bitcoin Price Movement and Immediate Market Context
The descent below $64,000 marks a significant technical level breach for Bitcoin. Historically, round-number thresholds often serve as psychological support or resistance zones. This specific price point had previously acted as a consolidation area during recent trading sessions. Market data reveals increased selling pressure emerged during Asian trading hours. Subsequently, this pressure accelerated through European market openings. Trading volume analysis shows a 24% increase compared to the previous day’s average. This volume spike typically accompanies decisive price movements.
Several concurrent factors likely contributed to this downward movement. First, broader macroeconomic indicators showed mixed signals this week. Second, regulatory developments in multiple jurisdictions created uncertainty. Third, technical indicators had been flashing warning signs for several days. The Relative Strength Index (RSI) entered overbought territory recently. Meanwhile, moving averages began showing divergence patterns. These technical warnings preceded today’s price action.
Comparative Market Performance Analysis
Bitcoin’s decline occurred alongside movements in traditional financial markets. The S&P 500 showed modest gains during the same period. Conversely, gold prices remained relatively stable. This divergence suggests cryptocurrency-specific factors are at play. The table below illustrates key comparative metrics:
| Asset | 24-Hour Change | 30-Day Trend | Market Correlation |
|---|---|---|---|
| Bitcoin (BTC) | -3.2% | +8.5% | Decoupling |
| S&P 500 | +0.4% | +2.1% | Traditional |
| Gold | +0.1% | -1.2% | Safe Haven |
| Ethereum (ETH) | -4.1% | +12.3% | High Correlation |
This comparative analysis reveals Bitcoin’s unique position currently. The cryptocurrency market often moves independently from traditional assets. However, increasing institutional adoption has created new correlations. These relationships continue evolving as market structures mature.
Technical Analysis and Key Support Levels
Technical analysts are closely monitoring several critical price levels following this decline. The $63,500 zone represents immediate support based on historical data. Below that, the $62,000 level served as strong support during previous corrections. Resistance now forms around $65,200, which was yesterday’s consolidation point. Chart patterns suggest potential for further testing of lower supports. The 50-day moving average currently sits at $61,800. This moving average has provided reliable support throughout 2024.
Several technical indicators warrant attention:
- Moving Average Convergence Divergence (MACD): Shows bearish crossover signal
- Bollinger Bands: Price touching lower band suggests potential oversold conditions
- Fibonacci Retracement: 0.382 level at $63,200 acting as intermediate support
- Volume Profile: High volume node at $64,500 now acting as resistance
These technical factors provide context for the current price action. However, fundamental developments equally influence market direction. The interplay between technical and fundamental factors creates complex market dynamics.
Fundamental Factors Influencing Bitcoin’s Price
Multiple fundamental developments coincide with today’s price movement. Regulatory clarity remains a persistent concern for institutional investors. Recent statements from financial authorities in several countries created uncertainty. Additionally, macroeconomic policy decisions impact cryptocurrency valuations. Interest rate expectations influence investor risk appetite significantly. Inflation data releases this week showed unexpected persistence. Consequently, investors adjusted their portfolio allocations accordingly.
Network fundamentals continue showing strength despite price volatility. Bitcoin’s hash rate reached new all-time highs recently. This metric measures the total computational power securing the network. Higher hash rates indicate greater network security and miner commitment. Transaction volume remains robust across major exchanges. Furthermore, active address counts show consistent growth patterns. These fundamental metrics suggest underlying network health persists.
Institutional Investment Flows and Market Structure
Institutional participation patterns provide crucial market insights. Exchange-traded fund (ETF) flows showed net outflows yesterday. This marked the first outflow in twelve consecutive trading days. Large wallet movements also indicate potential profit-taking behavior. Blockchain analytics firms reported significant transfers to exchanges. These transfers often precede selling activity. However, long-term holders continue accumulating positions. Their behavior suggests confidence in Bitcoin’s long-term value proposition.
The derivatives market shows interesting developments. Open interest in futures contracts declined moderately. This suggests some leverage unwinding occurred. Funding rates normalized after reaching elevated levels recently. Options market data indicates increased put buying activity. This represents hedging against further downside. These derivatives metrics reflect professional trader positioning.
Historical Context and Market Cycle Analysis
Bitcoin’s current position within its market cycle provides valuable perspective. Historical data reveals typical correction patterns during bull markets. Average pullbacks during previous cycles measured approximately 30%. The current decline remains well within historical norms. Previous bull markets experienced multiple 20-30% corrections. These corrections often created buying opportunities for long-term investors.
The four-year halving cycle remains a fundamental framework. The most recent halving occurred in April 2024. Historical patterns suggest post-halving appreciation typically follows initial consolidation. However, each cycle exhibits unique characteristics. Current adoption metrics exceed previous cycles significantly. Institutional infrastructure has matured substantially. Regulatory frameworks continue developing globally. These structural differences make direct historical comparisons challenging.
Market sentiment indicators provide additional context. The Crypto Fear & Greed Index moved from “Greed” to “Neutral” territory today. This shift reflects changing investor psychology. Extreme sentiment readings often precede market reversals. Current readings suggest balanced sentiment rather than panic. This balanced sentiment may support orderly market functioning.
Global Regulatory Developments and Their Impact
Regulatory clarity remains paramount for cryptocurrency market stability. Several jurisdictions announced policy updates this week. The European Union continues implementing its Markets in Crypto-Assets (MiCA) framework. Asian financial centers are refining their digital asset regulations. United States regulatory agencies issued mixed guidance recently. These developments create a complex global regulatory landscape.
Clear regulatory frameworks generally support market maturation. However, transitional periods often create uncertainty. Institutional investors particularly value regulatory predictability. Their participation increasingly drives market liquidity. Consequently, regulatory developments significantly influence price discovery mechanisms. The current regulatory environment continues evolving toward greater clarity.
Conclusion
Bitcoin’s decline below $64,000 represents a significant market development with multiple contributing factors. Technical indicators, fundamental developments, and macroeconomic conditions all influenced this price movement. The cryptocurrency maintains strong network fundamentals despite short-term volatility. Historical context suggests such corrections are normal during bull markets. Market participants should monitor key support levels and volume patterns. Regulatory developments and institutional flows will likely determine near-term direction. Ultimately, Bitcoin’s long-term trajectory depends on adoption trends and technological evolution. Today’s price action underscores the cryptocurrency market’s dynamic nature and the importance of comprehensive analysis.
FAQs
Q1: What caused Bitcoin to fall below $64,000?
Multiple factors contributed including technical corrections, regulatory uncertainty, profit-taking behavior, and shifting macroeconomic expectations. Increased selling pressure during Asian and European trading sessions accelerated the decline.
Q2: What are the key support levels to watch now?
Immediate support exists around $63,500, with stronger support at $62,000. The 50-day moving average at $61,800 represents another important technical level that has historically provided support.
Q3: How does this decline compare to historical Bitcoin corrections?
Current declines remain within historical norms for Bitcoin bull markets. Previous cycles experienced regular 20-30% corrections that often created buying opportunities before continued appreciation.
Q4: Are Bitcoin’s network fundamentals still strong despite the price drop?
Yes, fundamental metrics show continued strength. Bitcoin’s hash rate reached new all-time highs recently, transaction volume remains robust, and active address counts continue growing, indicating healthy network usage.
Q5: What should investors monitor in the coming days?
Key indicators include trading volume patterns, institutional ETF flows, regulatory announcements, macroeconomic data releases, and Bitcoin’s ability to hold above critical support levels around $63,500 and $62,000.
Related News
- Long-Dormant Wallets Reactivate to Buy ETH: Strategic Accumulation Signals Hidden Confidence
- Ark Invest’s Strategic $19M Coinbase Stock Sale Reveals Calculated Portfolio Rebalancing
- Bitcoin Soars: BTC Price Surges Past $70,000 Milestone in Major Rally