Global cryptocurrency markets face a decisive moment in early 2025 as Bitcoin approaches the critical $91,000 resistance level that technical analysts identify as the gateway to renewed bullish momentum. Market participants worldwide now scrutinize chart patterns and trading volumes for signals about Bitcoin’s next major directional move. The digital asset’s performance at this technical threshold could determine market sentiment for the coming quarter, according to multiple trading platform analyses and institutional research reports.
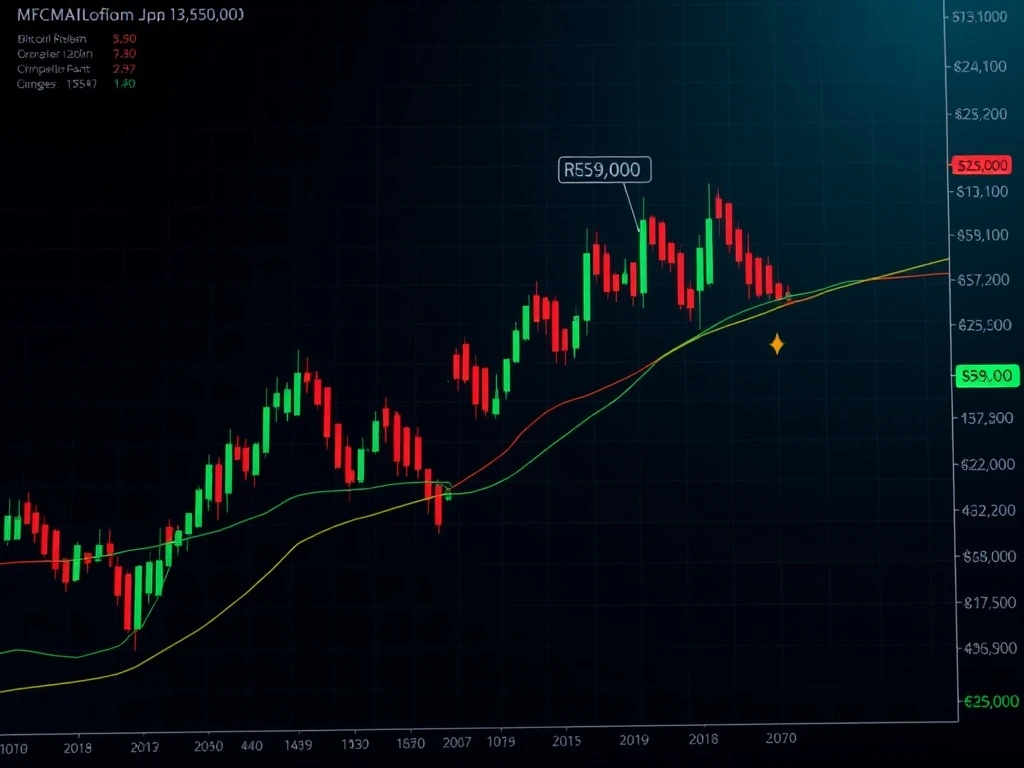
Bitcoin Technical Analysis: The $91,000 Resistance Explained
Technical analysts consistently highlight the $91,000 price level as a significant psychological and mathematical resistance point for Bitcoin. This threshold represents the convergence of several important technical indicators. First, it marks the 61.8% Fibonacci retracement level from Bitcoin’s all-time high in 2021. Additionally, this price point served as a previous support zone during Bitcoin’s consolidation phase throughout late 2024. Market data from major exchanges shows substantial sell orders clustered around this level, creating what traders call an “order wall.”
Historical price action reveals that Bitcoin has tested this resistance zone three times in the past six months. Each previous attempt resulted in rejection and subsequent price corrections ranging from 8% to 15%. The current approach differs significantly in market context, however. Trading volume during this latest ascent has increased by approximately 42% compared to previous attempts, according to aggregated exchange data. This volume surge suggests stronger conviction among buyers, potentially indicating a different outcome for the current test.
Market Structure and Technical Indicators
Several technical indicators provide context for Bitcoin’s current position relative to the $91,000 resistance. The Relative Strength Index (RSI) currently reads 62 on daily timeframes, indicating bullish momentum without reaching overbought conditions. Meanwhile, the Moving Average Convergence Divergence (MACD) shows positive crossover on weekly charts. Bollinger Bands have expanded significantly, with Bitcoin price currently testing the upper band boundary. This technical configuration typically precedes either a breakout or rejection scenario.
| Indicator | Current Reading | Bullish Signal | Bearish Signal |
|---|---|---|---|
| Daily RSI | 62 | Not overbought | Approaching resistance |
| Weekly MACD | Positive crossover | Momentum building | Histogram declining |
| Trading Volume | 42% above average | Strong participation | Potential exhaustion |
| Bollinger Bands | Testing upper band | Breakout potential | Rejection likely |
Market Context and Institutional Positioning
The current technical setup occurs within a specific macroeconomic and institutional context that differs substantially from previous resistance tests. Several factors contribute to this changed environment. First, regulatory clarity has improved in major markets throughout 2024 and early 2025. Second, institutional adoption continues expanding, with traditional financial institutions now offering more Bitcoin-related products. Third, the upcoming Bitcoin halving event in 2024 created supply dynamics that continue influencing market psychology.
Institutional positioning data reveals interesting patterns as Bitcoin approaches $91,000. Exchange-traded products holding Bitcoin now manage approximately $58 billion in assets globally. More significantly, the net flow into these products turned positive in the final quarter of 2024 after several months of outflows. This institutional accumulation pattern often precedes major price movements, according to historical correlation studies published by financial research firms.
On-Chain Metrics and Network Fundamentals
Beyond price charts, Bitcoin’s underlying network metrics provide additional context for the current resistance test. The network’s hash rate reached new all-time highs in January 2025, indicating robust security and miner commitment. Active address counts have increased by 18% year-over-year, suggesting growing adoption. Meanwhile, the percentage of Bitcoin supply that hasn’t moved in over a year remains near historical highs at approximately 68%. This metric often indicates long-term holder conviction during price consolidation phases.
Several specific on-chain indicators merit particular attention. The Market Value to Realized Value (MVRV) ratio currently sits at 1.8, suggesting Bitcoin trades slightly above its realized price but well below levels associated with market tops. The Puell Multiple, which measures miner revenue relative to its yearly average, indicates miners are not under significant selling pressure at current prices. These fundamental metrics generally support the possibility of continued upward momentum if technical resistance breaks.
Historical Precedents and Pattern Recognition
Historical analysis reveals that Bitcoin has faced similar technical situations multiple times throughout its price history. The most relevant comparison comes from 2020, when Bitcoin struggled to break above $10,000 resistance before eventually succeeding and beginning a major bull run. That historical precedent shares several characteristics with the current situation. Both periods followed significant halving events, featured increasing institutional participation, and occurred during periods of monetary policy accommodation.
Technical analysts identify several specific chart patterns currently forming. A descending wedge pattern that began forming in late 2024 appears to be resolving upward. Simultaneously, Bitcoin has formed a series of higher lows since its last major correction, establishing what technicians call an “ascending base.” The combination of these patterns suggests building momentum toward a potential breakout. However, pattern recognition alone cannot guarantee outcomes, as markets frequently defy technical expectations during periods of high volatility.
- Descending Wedge Resolution: Typically bullish when breaking upward
- Ascending Base Formation: Indicates accumulation and strengthening support
- Volume Profile Analysis: Shows increased activity at current levels
- Timeframe Convergence: Daily, weekly, and monthly charts approaching alignment
Potential Scenarios and Market Implications
Market analysts generally outline three primary scenarios for Bitcoin’s interaction with the $91,000 resistance level. The first scenario involves a clean breakout with sustained volume, potentially propelling Bitcoin toward the $100,000 psychological barrier. The second scenario features a rejection and consolidation below resistance, possibly forming a new trading range between $82,000 and $91,000. The third scenario includes a false breakout above $91,000 followed by a sharp reversal, sometimes called a “bull trap” in trading terminology.
Each scenario carries distinct implications for broader cryptocurrency markets. A successful breakout would likely trigger increased altcoin activity as capital rotates throughout the ecosystem. A rejection scenario might strengthen Bitcoin’s dominance ratio as investors seek relative safety in the market leader. A false breakout could create volatility across all cryptocurrency assets, potentially testing liquidity throughout the sector. Historical data suggests that Bitcoin’s performance at major resistance levels often sets the tone for cryptocurrency markets for several subsequent months.
Risk Factors and External Considerations
Several external factors could influence Bitcoin’s ability to overcome the $91,000 resistance. Macroeconomic conditions remain particularly relevant, as interest rate policies and inflation data continue affecting risk asset valuations. Regulatory developments in major jurisdictions could impact market sentiment and institutional participation. Additionally, traditional market correlations have strengthened in recent months, making equity market performance another relevant consideration. Geopolitical events and currency market movements also represent potential influences on cryptocurrency valuations.
Technical analysts emphasize that risk management remains crucial during such decisive market moments. Position sizing, stop-loss placement, and portfolio diversification become particularly important when assets approach major technical levels. Historical volatility data shows that Bitcoin typically experiences increased price swings during resistance tests, with average daily ranges expanding by approximately 35% compared to consolidation periods. This volatility pattern underscores the importance of disciplined trading approaches regardless of directional bias.
Conclusion
Bitcoin stands at a critical technical juncture as it approaches the $91,000 resistance level that could determine near-term market direction. Multiple technical indicators, historical patterns, and fundamental metrics suggest this moment represents more than ordinary price action. The convergence of technical factors, institutional positioning, and favorable network fundamentals creates a compelling setup for potential bullish resolution. However, markets remain unpredictable, and technical analysis provides probabilities rather than certainties. Market participants should monitor volume patterns, price action around the resistance level, and broader market context as Bitcoin attempts this significant technical challenge. The outcome will likely influence cryptocurrency market sentiment and capital flows throughout 2025.
FAQs
Q1: Why is $91,000 specifically important for Bitcoin’s price?
The $91,000 level represents a convergence of technical factors including Fibonacci retracement levels, previous support/resistance zones, and substantial order book activity. It has rejected price advances multiple times, making it a psychologically significant threshold.
Q2: What happens if Bitcoin breaks above $91,000?
A confirmed breakout with sustained volume could trigger renewed bullish momentum, potentially targeting the $100,000 psychological level next. Historical patterns suggest such breakouts often precede extended upward movements when accompanied by fundamental strength.
Q3: How does institutional activity affect this resistance test?
Increased institutional participation through exchange-traded products and direct holdings provides additional buying pressure and potentially changes market dynamics compared to previous resistance tests dominated by retail traders.
Q4: What technical indicators should traders watch during this test?
Key indicators include trading volume during breakout attempts, RSI levels for overbought conditions, order book depth around $91,000, and Bitcoin’s performance relative to moving averages on multiple timeframes.
Q5: How long might Bitcoin consolidate if it fails to break resistance?
Historical resistance tests suggest consolidation periods ranging from several weeks to multiple months, depending on market context and fundamental developments. Previous rejections at this level resulted in corrections between 8% and 15% before renewed attempts.
Related News
- BlackRock Bitcoin ETF Filing Reveals Strategic Masterstroke: Dual-Purpose Fund Targets Both Growth and Income
- Data Breach Nightmare: 149 Million Login Credentials Exposed, Including 420,000 Binance Accounts
- Kraken DeFi Earn Launches Revolutionary Bridge Between Centralized and Decentralized Finance in Major Markets