Are you watching the Bitcoin price closely? After a period of strong upward movement, the market seems to be taking a breather. While short-term Bitcoin momentum shows signs of cooling, a look at key indicators like moving averages reveals a potentially different story for the longer term. Understanding these conflicting signals is crucial for navigating the current crypto market.
Analyzing Current Bitcoin Price Trends
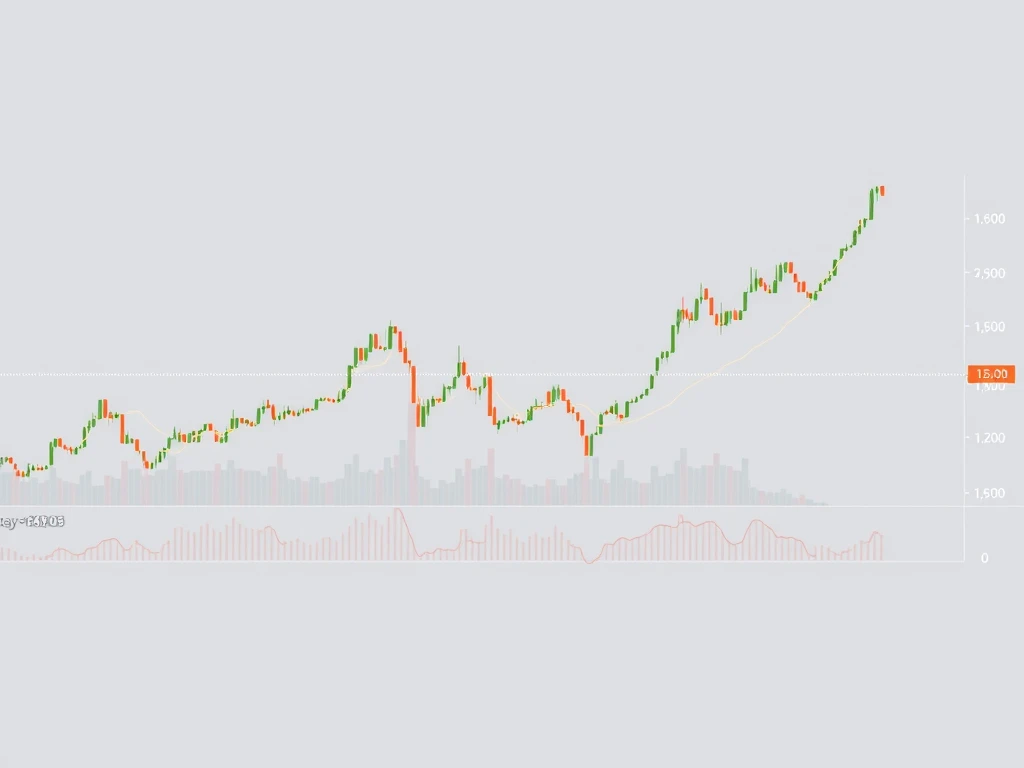
The recent price action for Bitcoin has been less volatile compared to previous weeks. We’ve seen a period of consolidation, where the price has traded within a relatively narrow range. This lack of explosive upward movement indicates that buying pressure might be temporarily easing. Volume has also seen fluctuations, sometimes dropping during this consolidation phase, which often aligns with cooling momentum. For traders and investors, this phase presents both challenges and opportunities, requiring careful observation rather than impulsive decisions.
Understanding Bitcoin Momentum Indicators
Momentum indicators are tools used in technical analysis to determine the strength or speed of price changes. Popular examples include the Relative Strength Index (RSI) or the Moving Average Convergence Divergence (MACD). Currently, many of these indicators are showing a slight downtick or flattening out. This suggests that while the price isn’t necessarily falling sharply, the *rate* at which it was increasing has slowed down. Think of it like a car going uphill – it’s still moving forward, but the acceleration isn’t as strong as it was on the flat road.
Here’s a simple breakdown of what cooling momentum can imply:
- Buyers are less aggressive at current price levels.
- Sellers might be taking profits or increasing their activity slightly.
- The market is pausing to consolidate before a potential next move.
- It doesn’t necessarily mean a crash is imminent, but it signals caution.
Why Moving Averages Remain a Bullish Signal
Despite the short-term momentum shift, longer-term indicators paint a more optimistic picture. Specifically, widely followed moving averages, such as the 50-day and 200-day simple moving averages (SMAs), continue to trend upwards. These averages smooth out price data to create a single flowing line, helping identify the direction of the overall trend.
Consider these points:
| Moving Average | Current Status | Interpretation |
|---|---|---|
| 50-day SMA | Above price, trending up | Acts as dynamic support; short/medium-term trend remains positive. |
| 200-day SMA | Well below price, trending up | Strong long-term trend remains bullish; a significant historical support level. |
When the shorter-term moving average is above the longer-term one, and both are sloping upwards, it’s generally considered a strong bullish signal for the overall trend. The fact that the Bitcoin price is trading above these key averages reinforces the underlying strength of the market despite the recent pause.
What’s Next for the Crypto Market? Actionable Insights
So, how should investors and traders interpret these mixed signals? The cooling momentum suggests that a significant upward push might not happen immediately. The bullish moving averages, however, indicate that dips could be viewed as buying opportunities within the context of an ongoing uptrend.
Actionable Insights:
- For Long-Term Holders: The current consolidation might be seen as healthy price action. Continue to hold or consider adding on dips towards key moving average levels if your strategy allows.
- For Short-Term Traders: Pay close attention to support and resistance levels formed during the consolidation. A break above resistance could signal renewed momentum, while a break below support might indicate a deeper pullback.
- Monitor Volume: Watch for increases in volume accompanying price moves. High volume on a breakout or breakdown provides more conviction to the move.
- Look at Other Indicators: Combine the analysis of momentum and moving averages with other technical analysis tools to get a more complete picture.
The crypto market is dynamic, and relying on a single indicator is rarely sufficient. The interplay between short-term momentum and long-term trend indicators like moving averages provides a nuanced view.
Summary: Navigating the Current Bitcoin Landscape
In conclusion, while the immediate upward pressure on the Bitcoin price has lessened, suggesting a cooling of short-term Bitcoin momentum, the enduring bullish stance of key moving averages provides a foundation of underlying strength. This period of consolidation is a natural part of market cycles. It allows the market to digest recent gains before potentially making its next move. For those participating in the crypto market, this is a time for careful observation, informed decision-making based on solid technical analysis, and patience. The overall trend remains positive, supported by those crucial long-term averages, offering hope for future appreciation despite the current sideways grind.
Related News
- Trump’s Bold Promise: US Crypto Capital Vision Takes Center Stage at Davos Summit
- XRP Price Analysis: Critical Support Battle at $1.85 Tests Market Resolve
- Coinbase Listing Roadmap Expands with Strategic Additions of TRIA and ZAMA Tokens