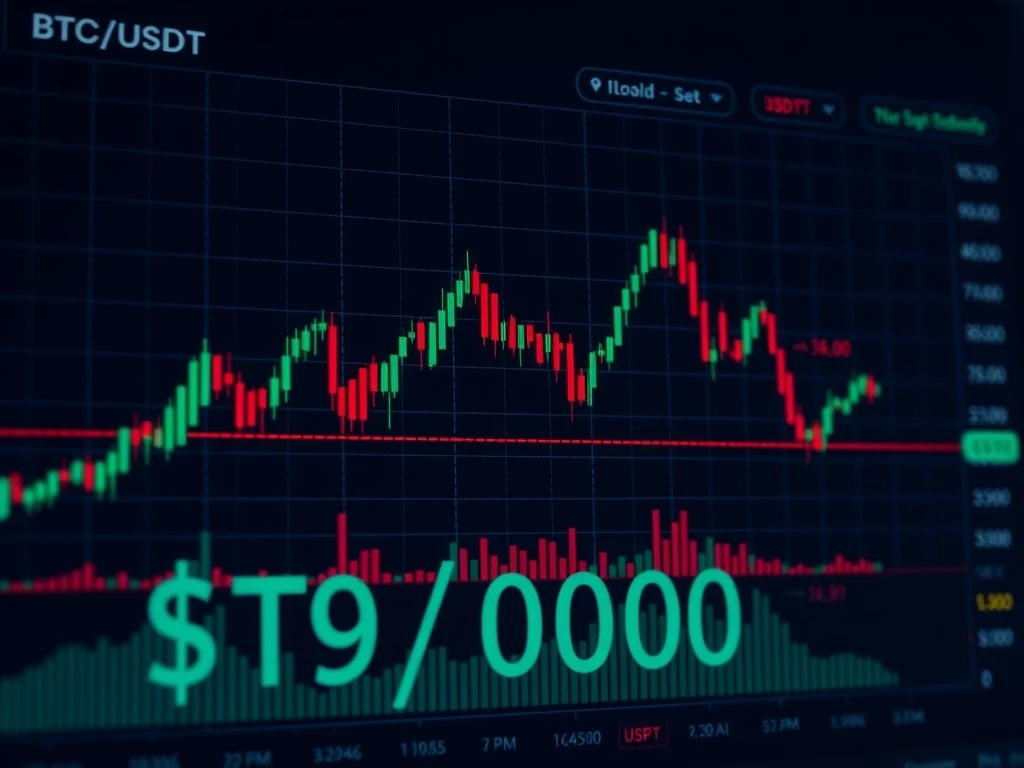
Global cryptocurrency markets witnessed a significant development today as Bitcoin, the world’s leading digital asset, breached the crucial $90,000 psychological support level. According to real-time market monitoring data from Crypto News Room, BTC traded at $89,999 on the Binance USDT market, marking a notable decline from recent price levels. This movement represents more than just a numerical change; it signals potential shifts in market sentiment and trading patterns that merit careful examination.
Bitcoin Price Analysis: Understanding the $90,000 Threshold
Market analysts immediately recognized the importance of Bitcoin falling below $90,000. This price point has served as a significant psychological barrier and technical support level throughout recent trading sessions. The breach occurred during active trading hours on Binance, one of the world’s largest cryptocurrency exchanges by trading volume. Technical analysts typically monitor such round-number levels because they often represent accumulation zones for institutional investors and important decision points for retail traders.
Historical data reveals that similar round-number thresholds have previously acted as both support and resistance levels. For instance, Bitcoin’s behavior around $60,000 and $70,000 demonstrated comparable patterns of consolidation and breakout. The current movement below $90,000 suggests potential testing of lower support levels. Market depth analysis shows substantial liquidity around this price region, indicating significant trading interest from both buyers and sellers.
Market Context and Contributing Factors
Several concurrent developments in global financial markets provide context for Bitcoin’s price movement. Traditional equity markets have experienced increased volatility recently, particularly in technology sectors that often correlate with cryptocurrency performance. Additionally, macroeconomic indicators including inflation data and central bank policy announcements have created uncertainty across multiple asset classes. Cryptocurrency markets frequently react to these broader financial conditions.
Technical Indicators and Trading Volume Analysis
Trading volume patterns offer crucial insights into market dynamics surrounding this price movement. The decline below $90,000 coincided with above-average trading volume on Binance’s USDT pairing. This suggests genuine market participation rather than isolated algorithmic trading. Key technical indicators including moving averages and relative strength measurements provide additional context for understanding current market conditions.
| Level Type | Price | Significance |
|---|---|---|
| Immediate Resistance | $92,500 | Previous consolidation zone |
| Current Price | $89,999 | Below psychological support |
| Next Support | $87,000 | Technical Fibonacci level |
| Major Support | $84,500 | 200-day moving average area |
The cryptocurrency market structure reveals important patterns when examining Bitcoin’s relationship with alternative digital assets. Typically, when Bitcoin experiences significant movements, other cryptocurrencies demonstrate correlated behavior, though often with amplified volatility. This interconnectedness underscores Bitcoin’s continuing role as the market benchmark and liquidity anchor for the entire digital asset ecosystem.
Exchange Dynamics and Trading Environment
Binance’s USDT market represents one of the most liquid trading pairs for Bitcoin globally. The USDT (Tether) stablecoin pairing allows traders to move between Bitcoin and a dollar-pegged asset without exiting the cryptocurrency ecosystem. This specific market’s price discovery often influences pricing across other exchanges and trading platforms. The $89,999 price point reflects real-time supply and demand dynamics between market participants.
Exchange data reveals several important characteristics about current market conditions:
- Order book depth shows balanced liquidity above and below current price levels
- Funding rates across perpetual swap markets indicate neutral to slightly negative sentiment
- Open interest in derivatives markets remains elevated despite price decline
- Spot market volumes demonstrate sustained institutional participation
Historical Precedents and Market Psychology
Previous instances of Bitcoin breaching significant psychological levels provide valuable perspective. Historically, such movements have often preceded periods of consolidation before establishing new trading ranges. Market psychology around round numbers frequently creates self-fulfilling prophecies as traders place orders at these levels. The $90,000 threshold had previously attracted attention as both a profit-taking zone and accumulation area throughout recent months.
Longer-term charts reveal that Bitcoin has experienced similar percentage declines multiple times during its bull market cycles. These corrections typically range between 20-30% before resuming upward trajectories. Current market structure analysis suggests that healthy corrections contribute to sustainable long-term growth by shaking out weak positions and allowing new capital entry at more attractive price points.
Institutional Perspective and Market Maturation
The cryptocurrency market’s increasing institutionalization affects how price movements develop and sustain. Professional trading firms and asset managers typically employ sophisticated risk management strategies that respond to technical levels like $90,000. Their participation adds layers of complexity to market dynamics that didn’t exist during earlier phases of cryptocurrency development. This maturation process contributes to both increased liquidity and different volatility patterns compared to previous market cycles.
Regulatory developments continue influencing market sentiment and trading behavior. Clearer regulatory frameworks in major jurisdictions provide institutional investors with greater confidence to participate in cryptocurrency markets. However, regulatory uncertainty in specific regions can still create temporary market dislocations. The current price movement occurs within this evolving regulatory landscape that increasingly recognizes cryptocurrencies as legitimate financial assets.
Conclusion
Bitcoin’s decline below $90,000 represents a significant technical and psychological development in cryptocurrency markets. The movement to $89,999 on Binance’s USDT market reflects complex interactions between technical factors, market sentiment, and broader financial conditions. While price movements capture immediate attention, underlying market structure remains robust with sustained institutional participation and growing ecosystem development. Market participants will monitor whether this level becomes resistance or if Bitcoin reclaims it as support in coming trading sessions. The Bitcoin price action continues demonstrating the dynamic nature of digital asset markets as they mature within the global financial landscape.
FAQs
Q1: Why is the $90,000 level psychologically important for Bitcoin?
Round-number price levels like $90,000 often attract significant attention from traders and investors. These levels frequently serve as mental benchmarks where market participants place orders, set profit targets, or establish stop-loss positions. The concentration of trading activity at these levels can create self-reinforcing support or resistance zones.
Q2: How does Bitcoin’s price on Binance affect other exchanges?
Binance typically represents one of the largest cryptocurrency exchanges by trading volume, making its price discovery influential across global markets. Arbitrage traders quickly exploit price differences between exchanges, ensuring prices remain relatively synchronized. However, temporary discrepancies can occur during periods of high volatility or liquidity constraints on specific platforms.
Q3: What technical indicators should traders watch after this movement?
Traders typically monitor several key indicators following significant price movements. These include trading volume confirmation, relative strength index (RSI) levels, moving average alignments, and support/resistance retests. Additionally, market depth and order book analysis provide insights into potential supply and demand imbalances around current price levels.
Q4: How do stablecoin pairs like BTC/USDT differ from fiat pairs?
Stablecoin trading pairs allow continuous cryptocurrency trading without exposure to traditional banking hours or fiat currency transfer delays. USDT (Tether) maintains a theoretical 1:1 peg with the US dollar, providing dollar-denominated pricing while remaining within the cryptocurrency ecosystem. This creates more efficient markets but introduces specific risks related to stablecoin collateralization and regulatory treatment.
Q5: What historical patterns exist around Bitcoin breaching psychological levels?
Historical analysis reveals that Bitcoin frequently experiences increased volatility around round-number thresholds. These levels often require multiple tests before establishing definitive support or resistance. Previous breaches of significant levels like $10,000, $20,000, and $60,000 typically involved consolidation periods before sustained moves in either direction, with false breaks occurring in both directions.
Related News
- Decentralized Validator Technology: Vitalik Buterin’s Critical Push for Native Ethereum Integration
- Sui Launches Transformative LAUNCH Career Internship Program to Cultivate Next-Generation Blockchain Talent
- RedStone Acquisition of Security Token Market Signals Strategic Shift in RWA Tokenization Landscape