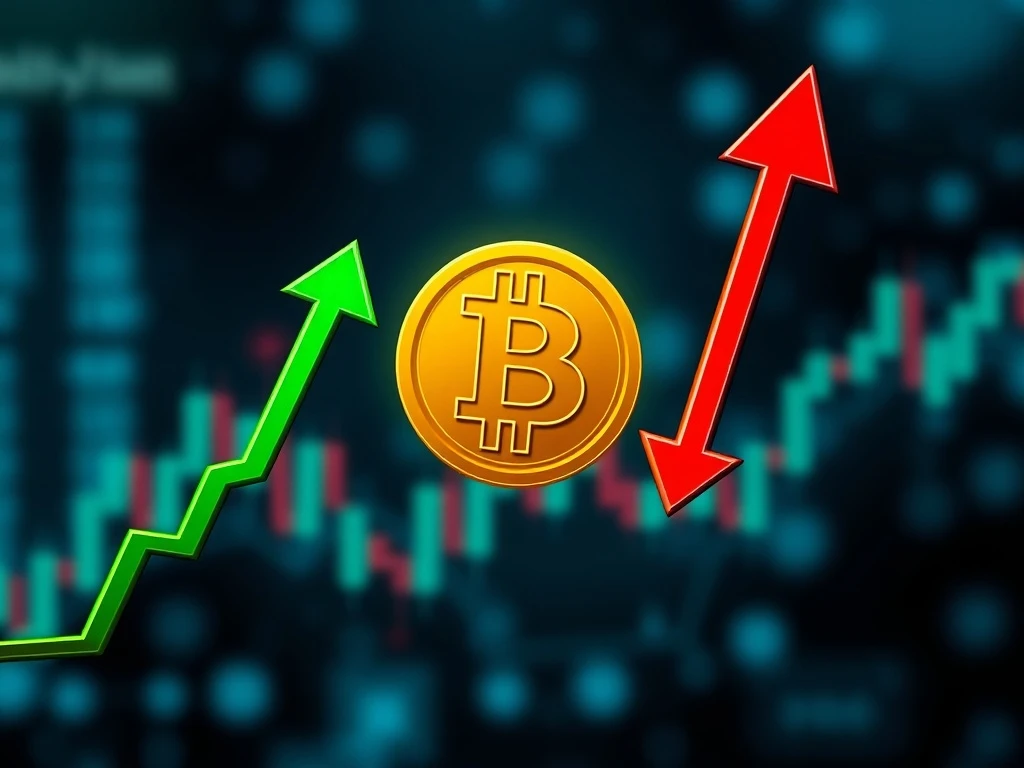
The **Bitcoin price** currently stands at a pivotal juncture. Traders and investors observe a significant compression in its trading range. This tight consolidation signals an imminent, potentially powerful move. Market participants are on high alert. They keenly await the direction of the next decisive shift. Understanding this period is crucial for anyone involved in the digital asset space.
Unpacking the Squeezed Bitcoin Price Action
For several weeks, **Bitcoin price action** has shown remarkably reduced volatility. The premier cryptocurrency has traded within increasingly narrow boundaries. This pattern frequently precedes a major price shift. Historically, such periods of low volatility rarely last long. Consequently, market attention focuses on potential triggers. Analysts closely examine charts for clues regarding future momentum. This phase often tests investor patience.
Technical Indicators Point to Imminent BTC Breakout
Several key technical indicators confirm this tightening range. On daily charts, moving averages are converging noticeably. Furthermore, the Bollinger Bands, a volatility measure, have squeezed significantly. This signals reduced market energy. Moreover, trading volume has seen a consistent decline during this period. Lower volume during consolidation often precedes a sharp **BTC breakout**. These metrics provide valuable insights. They help traders anticipate the next directional move. Therefore, monitoring these indicators becomes paramount.
Key Levels for the Next Bitcoin Price Move
Identifying crucial support and resistance levels is vital for any **Bitcoin price** analysis. Currently, Bitcoin finds strong immediate support around the $60,000 mark. A sustained break below this level could trigger further declines. This might lead to tests of $58,000 or even $55,000. On the upside, significant resistance lies near $65,000. Overcoming this barrier would indicate bullish strength. A push beyond $68,000 could open the path towards $70,000 and higher. The price needs a clear push beyond these boundaries. This will establish a new trend. Traders often set their stop-losses and take-profit orders around these critical points.
Gauging Crypto Market Analysis and Sentiment
Beyond technicals, comprehensive **crypto market analysis** reveals mixed signals. The Fear & Greed Index, a popular gauge of investor emotion, currently hovers in a neutral zone. This indicates indecision among market participants. On-chain data also offers interesting insights. Whale transactions remain relatively subdued, suggesting no immediate large-scale accumulation or distribution. Exchange net flows show no strong directional bias. This implies a balance between deposits and withdrawals. Global macroeconomic factors also play a significant role. Interest rate decisions, inflation reports, and geopolitical events influence overall **Bitcoin market sentiment**. These broader economic trends impact investor confidence in risk assets. Consequently, a shift in these factors could quickly sway the market.
Bullish Scenarios: The Path to Upside Momentum
A bullish **BTC breakout** would likely target higher resistance levels. A clear surge above the primary resistance, for instance, $65,000, accompanied by strong buying volume, is essential. This could propel Bitcoin towards $68,000, then potentially $72,000. Positive news, such as a new institutional adoption or favorable regulatory developments, could fuel such a move. A successful retest of the broken resistance as new support would confirm the uptrend. This scenario offers significant profit potential for long positions. Furthermore, a decisive move above these levels could trigger a cascade of liquidations for short positions, adding to upward momentum.
Bearish Scenarios: Risks of a Downside Shift
Conversely, a bearish breakdown poses significant risks for the market. A decisive drop below the established support line, for example, $60,000, is concerning. This could quickly lead to further price depreciation. Targets might include $58,000, $55,000, or even lower. Increased regulatory scrutiny, unexpected negative news, or a broader market downturn could trigger this outcome. A breakdown would likely accelerate selling pressure. It could also activate stop-loss orders, leading to further declines. Traders should prepare for potential downside volatility. Moreover, a failure to reclaim key support levels quickly would strengthen the bearish outlook.
Historical Context of Bitcoin Breakouts
Bitcoin’s trading history features numerous periods of tight consolidation. These phases have often resolved with dramatic price movements. Some breakouts led to massive rallies, propelling prices to new all-time highs. Others resulted in significant corrections, sometimes leading to prolonged bear markets. Each cycle presents unique circumstances and catalysts. However, the underlying principle remains: extended consolidation typically precedes expansion. Understanding past patterns helps inform current expectations. Yet, past performance never guarantees future results. Therefore, traders must always exercise caution and adapt to current market conditions.
Navigating the Volatility: A Concluding Thought on Bitcoin Price
The current **Bitcoin price** situation demands careful observation. The market remains poised for a significant move. Both bulls and bears present strong arguments for their respective outlooks. Investors must exercise caution during this uncertain period. Implementing sound risk management strategies is crucial. This includes setting appropriate stop-loss orders and diversifying portfolios. Stay informed about all market developments, including technical shifts and macroeconomic news. The next major trend will soon emerge. Consequently, preparedness is key to navigating this dynamic landscape effectively.
Related News
- Stunning 770 Million USDT Whale Transfer from HTX to Aave Signals Major DeFi Strategy Shift
- Tim Draper’s Unwavering Bitcoin Journey: From $4 Purchase to Defying Market Crashes with Conviction
- Ethereum Whale’s Stunning Move: Faces $1.8M Potential Loss After $5.92M Exchange Deposit