The cryptocurrency world holds its breath as a significant alert emerges regarding the Bitcoin price. Analysts are sounding the alarm, suggesting a deeper correction could be imminent for the leading digital asset. This news is particularly relevant for investors and traders closely monitoring market movements. Understanding the current technical landscape becomes paramount for navigating potential volatility.
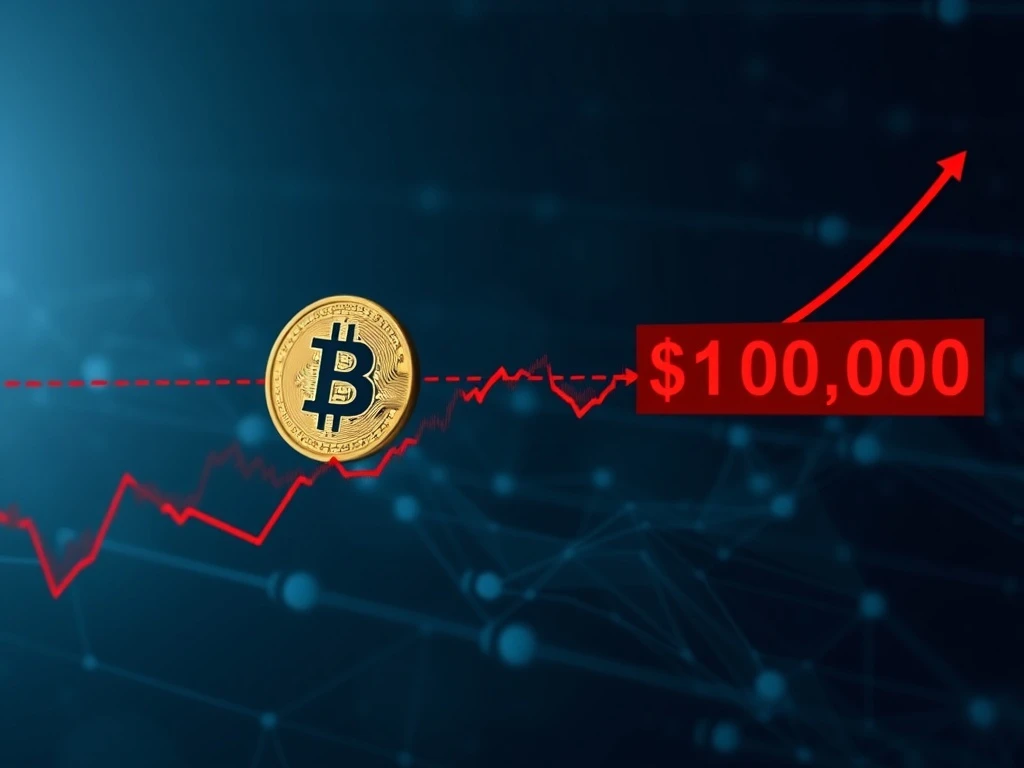
The Critical $101K Bitcoin Support Level
Bitcoin now faces a critical juncture. It risks a further correction if it fails to maintain the psychological support level of $101,000. This recent analysis comes from CryptoOnChain, a recognized contributor to the on-chain analytics platform CryptoQuant. Indeed, their insights often provide valuable perspectives on market dynamics. Bitcoin recently broke down from its long-held trading range. This range spanned from $107,000 to $123,000. Subsequently, it dropped sharply to $98,000. However, buying pressure quickly pushed the price back up. It stabilized around the $101,000 area. This specific level holds significant weight. It represents the lower boundary of a long-term ascending channel. This channel has been firmly in place since October 2023. Therefore, it marks a pivotal point for the current uptrend. A successful defense of this mark could mean the recent decline is merely a short-term correction. Conversely, a failure to hold this level would likely lead to the collapse of the ascending channel. This scenario would usher in a deeper corrective phase for the Bitcoin price.
Understanding BTC Correction Dynamics
Market corrections are a natural part of any asset’s lifecycle. A BTC correction typically refers to a significant price decline. This decline often follows a period of rapid growth. Historically, Bitcoin has experienced numerous corrections. These events can range from minor pullbacks to substantial bear markets. For instance, the crypto market saw notable corrections in 2017 and 2021. These periods tested investor resilience. They also reshaped market sentiment. Such corrections help to ‘cleanse’ the market. They often shake out overleveraged positions. Furthermore, they allow for price discovery. They also create new entry points for long-term investors. The current situation around the $101,000 mark suggests a potential turning point. If the support breaks, the market could see a cascading effect. This might lead to further price declines. Therefore, monitoring key indicators is essential. Traders often look at volume, moving averages, and support/resistance levels. These tools help them gauge the strength of a potential reversal or continuation of a trend. A deeper correction might target previous strong support zones. These zones could be around $90,000 or even lower. Thus, understanding these dynamics is crucial for all market participants.
The Role of On-Chain Data in Crypto Market Analysis
On-chain data provides invaluable insights into the fundamental health of the Bitcoin network. Unlike traditional financial markets, every transaction on the blockchain is public. This transparency allows analysts to track various metrics. These metrics include transaction volumes, active addresses, and exchange flows. CryptoQuant, the platform mentioned by CryptoOnChain, specializes in this form of crypto market analysis. Their tools help identify patterns and predict potential market shifts. For example, tracking the movement of Bitcoin from wallets to exchanges can indicate selling pressure. Conversely, movements from exchanges to cold storage often signal accumulation. Whale movements, representing large holders, are also closely watched. Their actions can significantly influence price. The analyst’s reference to the ‘long-held trading range’ and ‘ascending channel’ likely stems from such data. On-chain metrics offer a unique lens. They allow for a more granular understanding of investor behavior. This understanding often goes beyond simple price charts. Ultimately, on-chain data complements technical analysis. It provides a more holistic view of the market. This integrated approach enhances the accuracy of predictions. It helps traders make informed decisions. Consequently, many professional traders now consider it indispensable.
What Drives Bitcoin Price Volatility?
Several factors contribute to the inherent volatility of the Bitcoin price. Firstly, market sentiment plays a huge role. News events, regulatory changes, and celebrity endorsements can all sway investor confidence. Secondly, macroeconomic factors increasingly influence crypto. Inflation concerns, interest rate hikes, and global economic stability often correlate with Bitcoin’s performance. For instance, during periods of high inflation, some investors view Bitcoin as a hedge. This perception can drive demand. Thirdly, technological developments within the crypto space impact prices. Upgrades to the Bitcoin network or the emergence of new Layer 2 solutions can affect its utility and value. Furthermore, institutional adoption continues to grow. Large corporations and investment funds entering the market bring significant capital. Their involvement adds legitimacy and liquidity. However, their large-scale movements can also amplify price swings. The halving event, which reduces the supply of new Bitcoin, also historically impacts price. These events create supply shocks. They often lead to upward price pressure in the long term. Understanding these diverse drivers helps contextualize market movements. It provides a broader perspective beyond immediate price action. Therefore, a comprehensive analysis considers all these elements.
Navigating Future Scenarios for Bitcoin Support
The immediate future for Bitcoin hinges on its ability to defend the critical Bitcoin support level at $101,000. Two primary scenarios emerge from the current analysis. In the first scenario, Bitcoin successfully holds this psychological mark. The recent dip would then be considered a healthy, short-term correction. This outcome would validate the strength of the long-term ascending channel. It might signal a potential rebound. Traders would then look for signs of accumulation. They would also watch for a resumption of the upward trend. Potential resistance levels above $101,000 would become the next targets. These could include the previous trading range of $107,000 to $123,000. This scenario would instill renewed confidence in the market. It would suggest that the underlying bullish momentum remains intact. However, the second scenario presents a more challenging outlook. If Bitcoin fails to maintain $101,000, the ascending channel would likely collapse. This breakdown could trigger a deeper corrective phase. Analysts might then project new support levels. These could potentially be around $90,000, $85,000, or even lower. Such a move would require investors to re-evaluate their positions. It might also lead to increased fear and uncertainty. Consequently, market participants should prepare for both possibilities. Prudent risk management becomes essential. Setting stop-loss orders and diversifying portfolios are common strategies. Ultimately, the next few days or weeks will be crucial. They will determine the short-to-medium term trajectory of Bitcoin.
Conclusion: A Vigilant Approach to Bitcoin’s Path
The current analysis from CryptoOnChain highlights a crucial period for Bitcoin price action. The $101,000 level stands as a pivotal psychological and technical support. Its defense will dictate whether the market experiences a minor pullback or a more significant BTC correction. Furthermore, the insights derived from on-chain data continue to provide valuable context for this dynamic. This level of detail helps inform robust crypto market analysis. Investors and traders must remain vigilant. They should monitor price movements and key indicators closely. Understanding the underlying forces driving Bitcoin’s volatility is also paramount. Ultimately, informed decision-making, combined with a clear risk management strategy, will be essential. This approach will help navigate the evolving landscape of the cryptocurrency market.
Frequently Asked Questions (FAQs)
Q1: What makes the $101,000 level so important for Bitcoin?
A1: The $101,000 level is crucial because it represents a significant psychological support. It also marks the lower boundary of a long-term ascending channel that has been in place since October 2023. Breaking below this level could signal a collapse of the uptrend.
Q2: What is an ‘ascending channel’ in crypto trading?
A2: An ascending channel is a bullish chart pattern. It consists of two parallel upward-sloping trendlines. The price action trades between these lines. The lower line acts as support, and the upper line acts as resistance. A break below the lower line suggests a loss of bullish momentum.
Q3: How does on-chain data contribute to Bitcoin price analysis?
A3: On-chain data provides insights into actual blockchain transactions. It tracks metrics like active addresses, transaction volumes, and exchange flows. This data helps analysts understand investor behavior and market sentiment. It can often signal potential shifts before they appear on price charts.
Q4: What are the potential implications if Bitcoin breaks below $101,000?
A4: If Bitcoin breaks below $101,000, it would likely lead to a deeper corrective phase. This could mean further price declines, potentially targeting lower support levels around $90,000 or $85,000. It would also suggest a breakdown of the current bullish market structure.
Q5: What should investors do during a potential BTC correction?
A5: During a correction, investors often consider risk management strategies. These include setting stop-loss orders to limit potential losses, diversifying portfolios, and re-evaluating their investment thesis. Some long-term investors may also view deeper corrections as opportunities for accumulation.
Related News
- Stablecoin Adoption Soars: 200 Million Addresses Now Hold Digital Dollars, Signaling Massive Mainstream Shift
- NIP Group’s Stunning $14M Bitcoin Mining Debut: Esports Giant Joins Top 20 US Public Miners
- State Street Tokenized Products: Revolutionary Boston-Based TradFi Giant Embraces Blockchain Future