The world of cryptocurrency is always buzzing, and all eyes are often on the king: Bitcoin. Traders and investors constantly seek signals to understand where the Bitcoin price might be heading. Currently, technical indicators like the MACD and Momentum are flashing signals that suggest potential for further gains. Let’s dive into what these indicators are and why they matter for Bitcoin’s trajectory.
What Do MACD and Momentum Indicators Tell Us About Bitcoin Price?
Technical analysis relies on studying past price data and trading volume to forecast future price movements. Two popular tools in a trader’s arsenal are the Moving Average Convergence Divergence (MACD) and the Momentum indicator. Both provide insights into the strength and direction of price trends.
- MACD Indicator: This trend-following momentum indicator shows the relationship between two moving averages of a security’s price. It’s calculated by subtracting the 26-period Exponential Moving Average (EMA) from the 12-period EMA. A 9-period EMA of the MACD (the signal line) is then plotted on top of the MACD, functioning as a trigger for buy and sell signals. When the MACD crosses above the signal line, it’s often seen as a bullish signal.
- Momentum Indicator: This simple indicator measures the rate of change in price. It compares the current price to a past price (typically 10 periods ago). A rising Momentum line suggests the price is increasing faster, indicating strengthening upward pressure. Conversely, a falling line indicates weakening pressure.
Why Are These Indicators Supporting Bitcoin’s Potential for Further Gains?
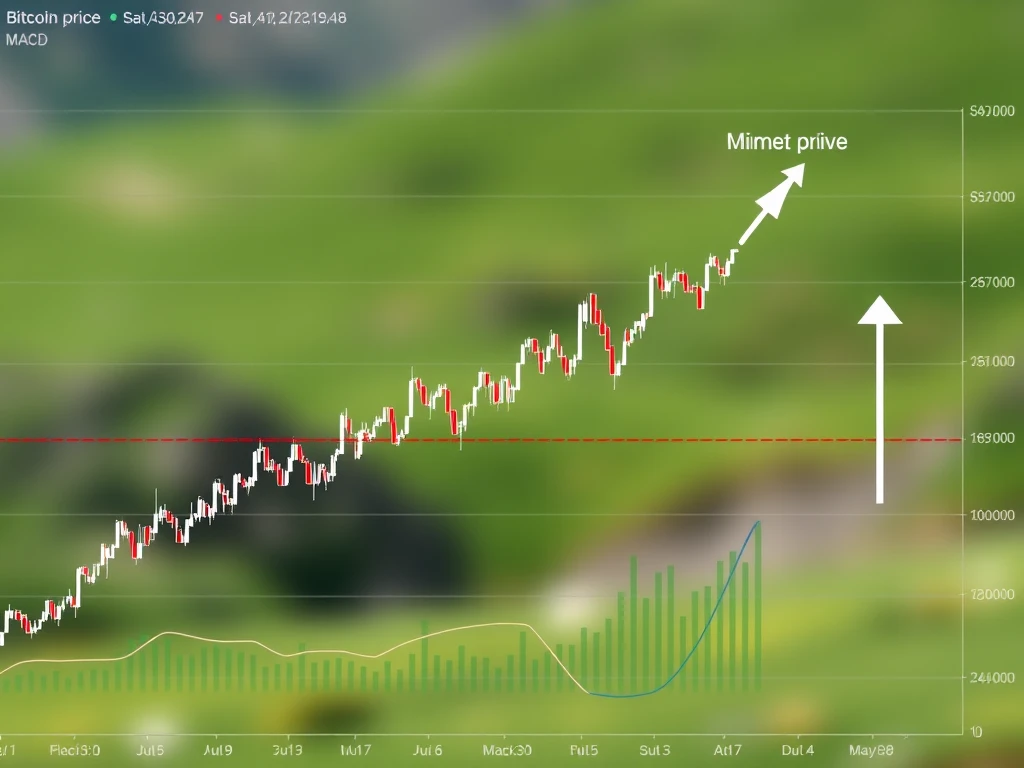
Recent analysis of the Bitcoin price chart shows constructive signals from both the MACD and Momentum indicators. Specifically:
The MACD line has crossed above its signal line on key timeframes. This bullish crossover is a classic signal interpreted by technical analysts as a sign that upward momentum is increasing and could lead to a sustained price move higher.
Simultaneously, the Momentum indicator has been trending upwards. This confirms that the pace of price increases is accelerating or maintaining strength, reinforcing the bullish sentiment suggested by the MACD. When both indicators align, providing similar bullish signals, it strengthens the conviction behind the potential for further price appreciation.
Interpreting Signals: A Look at Bitcoin Technical Analysis
Understanding these indicators is crucial for effective Bitcoin technical analysis. While no single indicator is foolproof, observing multiple tools can provide a clearer picture. The current alignment of MACD and Momentum suggests that the underlying buying pressure for Bitcoin is increasing. This doesn’t guarantee gains, but it indicates that the conditions are favorable for upward movement based on historical patterns.
Consider these points when interpreting the signals:
- Confirmation: The bullish crossover on MACD is confirmed by the upward trend in Momentum. This confluence of signals is more powerful than a single indicator acting alone.
- Context: Always look at these signals within the broader market context. What are the overall crypto market trends? Are there fundamental news events impacting sentiment?
- Divergence: Watch for potential divergences. If the price makes a new high but the indicator makes a lower high, it could signal weakening momentum despite the price action. Currently, indicators seem to be confirming price strength.
Actionable Insights for Tracking Crypto Market Trends
For those watching the crypto market trends, the signals from MACD and Momentum offer actionable insights:
- The current readings suggest maintaining a positive outlook on Bitcoin in the short to medium term.
- Traders might look for opportunities to enter or add to positions, using these indicators as part of their decision-making process.
- It’s important to set stop-losses to manage risk, as market conditions can change rapidly regardless of indicator signals.
- Continue monitoring these indicators along with others, like volume and support/resistance levels, for ongoing confirmation or potential shifts in trend.
Understanding the MACD indicator and the Momentum indicator provides valuable tools for navigating the volatile crypto landscape. While they are not crystal balls, their current posture adds weight to the argument for continued upward movement in the Bitcoin price.
What Are the Potential Challenges?
Despite the positive signals from MACD and Momentum, challenges remain. The crypto market is subject to sudden shifts due to regulatory news, macroeconomic factors, or unexpected large trades. Indicator signals can change quickly. A sudden downturn could lead to bearish crossovers or downward momentum shifts, invalidating the current bullish outlook. Relying solely on these two indicators without considering overall market sentiment and risk management is not advisable.
Summary: Bitcoin Price Outlook Supported by Key Indicators
In conclusion, the current technical setup for Bitcoin price, highlighted by bullish readings from the MACD and Momentum indicators, suggests a favorable environment for further gains. These tools, fundamental to Bitcoin technical analysis, indicate increasing buying pressure and strengthening upward momentum. While positive, it’s crucial to remember that indicators are historical tools and do not predict the future with certainty. Traders and investors should use these signals as part of a comprehensive strategy, staying informed about broader crypto market trends and employing sound risk management practices. The signals are promising, but vigilance remains key in the dynamic world of cryptocurrency.
Related News
- Bitcoin Whale Transfer Stuns Market: 2,873 BTC Moves to Gemini in $260 Million Transaction
- Silver Price Shatters $100 Barrier in Stunning Market Repricing
- Binance Stock Tokens: The Bold Potential Return of Crypto-Traditional Market Bridges