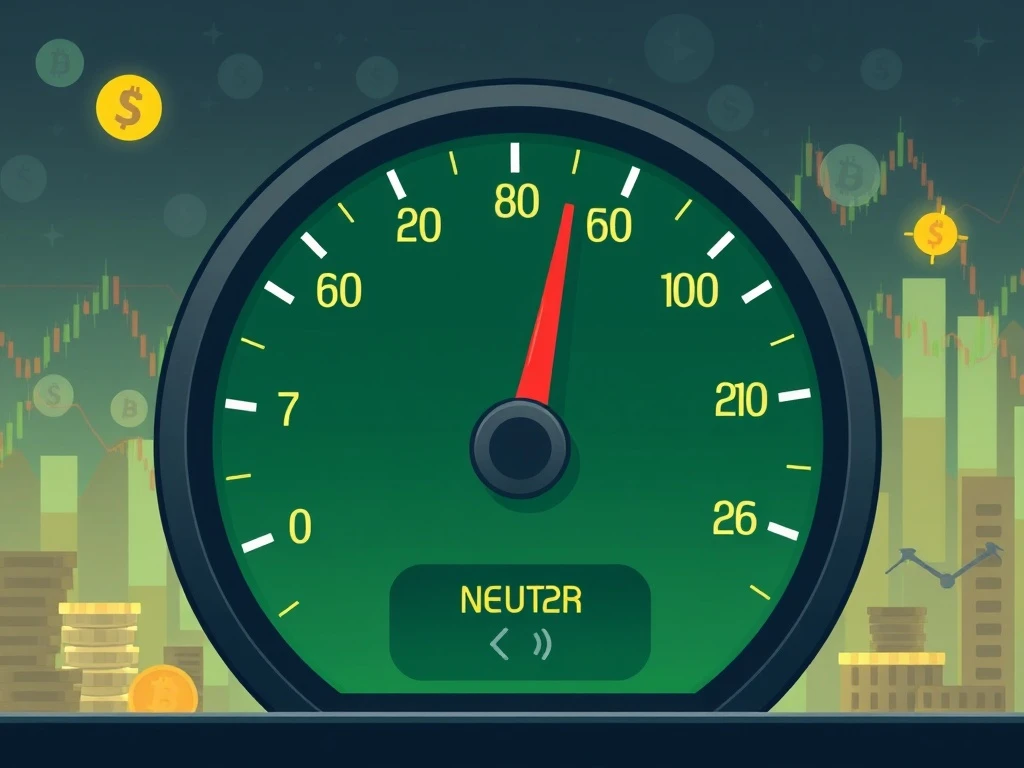
The Crypto Fear & Greed Index offers a vital snapshot of the cryptocurrency market’s emotional state. Recently, it registered 44. This score indicates a persistent level of fear among investors. Such readings provide crucial insights. They help market participants gauge overall market sentiment. This comprehensive guide will explore the index’s mechanics and implications.
Decoding the Crypto Fear & Greed Index
Understanding the Crypto Fear & Greed Index is essential for any market observer. This widely recognized tool measures collective investor emotion. It operates on a scale from 0 to 100. A score of 0 signifies extreme fear. Conversely, 100 represents extreme greed or optimism. This index does not predict prices. Instead, it reflects prevailing investor psychology. Historically, extreme fear can signal buying opportunities. Extreme greed might suggest a market correction is imminent. Therefore, tracking this index provides a unique perspective. It helps individuals assess potential market shifts.
The Six Pillars of Market Sentiment Calculation
The Crypto Fear & Greed Index relies on a composite of six key market factors. Each factor contributes a specific percentage to the final score. These components collectively paint a comprehensive picture. They capture various aspects of investor behavior. Let us explore each element in detail. Understanding these pillars is crucial. It helps interpret the index’s readings accurately. This methodology ensures a robust measure of market sentiment.
- Volatility (25%): Current crypto volatility is a major factor. It compares the current price drawdowns to average values. High volatility often indicates fear. Investors become uncertain. Sharp price movements can trigger panic selling. Therefore, increased volatility typically pushes the index lower.
- Trading Volume (25%): Trading volume provides another significant indicator. It measures the total amount of assets traded. High buying volumes in a rising market suggest greed. Conversely, high selling volumes in a falling market point to fear. Consistent high volume, regardless of direction, can also indicate strong interest. This factor helps confirm market trends.
- Social Media (15%): Social media sentiment analysis contributes to the index. It scans various platforms for keywords and mentions. An increase in fear-related terms lowers the score. Positive sentiment, however, raises it. This component captures the public’s immediate emotional response. It reflects broad public opinion quickly.
- Surveys (15%): Surveys offer direct insights into investor feelings. These polls ask participants about their market outlook. They provide a direct measure of investor confidence. Their results contribute to the overall sentiment score.
- Bitcoin Dominance (10%): Bitcoin dominance assesses Bitcoin’s share of the total crypto market capitalization. Rising dominance often signals fear. Investors may move from altcoins to Bitcoin. They see Bitcoin as a safer asset during uncertain times. Conversely, falling dominance can suggest increasing risk appetite. It shows money flowing into altcoins. Therefore, this metric is a key barometer of risk tolerance.
- Google Search Volume (10%): Google search trends reveal public interest. It tracks search queries related to cryptocurrencies. For instance, searches for ‘Bitcoin price manipulation’ might indicate fear. ‘How to buy crypto’ could signal growing interest. Higher search volumes, especially for positive terms, lift the index. Negative or panicked searches reduce it. This component captures broader public curiosity and concern.
Persistent Fear: What a 44 Means for Crypto Volatility
The current reading of 44 places the index squarely in the ‘fear’ category. This score suggests caution remains prevalent. Investors are not yet confident. They show reluctance to engage in significant buying. A score below 50 generally indicates fear. A move from 43 to 44 is marginal. It highlights the sustained apprehension in the market. This persistent fear often correlates with increased crypto volatility. Prices can swing wildly. Investors might react strongly to news. Therefore, market participants should remain vigilant.
Historical Context and Shifting Market Sentiment
Examining historical market sentiment provides valuable context. The Crypto Fear & Greed Index has seen extreme highs and lows. During bull markets, it often soared into the ‘extreme greed’ zone. Readings above 80 are common then. These periods typically precede price corrections. Conversely, deep bear markets push the index into ‘extreme fear.’ Scores below 20 are not uncommon. Such times historically presented strong accumulation phases. The current 44 sits in a middle ground of persistent fear. It is neither extreme panic nor rampant optimism. This level suggests a watchful waiting period. Many investors are likely holding positions. They await clearer market signals.
Bitcoin Dominance and its Market Impact
The role of Bitcoin dominance within the index is significant. As mentioned, it often acts as a risk barometer. When Bitcoin dominance rises, it usually means altcoins are underperforming. Investors seek the perceived safety of Bitcoin. This flight to quality indicates fear. Conversely, a decrease in Bitcoin’s market share often signals a broader altcoin rally. It shows renewed investor confidence in riskier assets. Therefore, changes in Bitcoin dominance can foreshadow broader market movements. Monitoring this metric offers valuable insights into capital flows. It helps assess overall market health and investor appetite for risk.
Analyzing Trading Volume and Crypto Volatility
Both trading volume and crypto volatility heavily influence the index. High trading volumes during price declines amplify fear. This shows strong selling pressure. Conversely, strong buying volume during uptrends indicates greed. The index captures these shifts. Moreover, elevated volatility creates uncertainty. Rapid price changes make investors nervous. They often hesitate to enter new positions. Therefore, a combination of high volatility and strong selling volume reinforces fear. This dynamic can suppress price appreciation. It maintains a cautious outlook among market participants. These factors are critical for understanding daily market shifts.
Navigating the Fear Zone with Prudence
Investors must approach the ‘fear’ zone with prudence. The Crypto Fear & Greed Index provides information. It does not dictate action. Some seasoned investors view fear as an opportunity. They follow the adage: ‘Be fearful when others are greedy, and greedy when others are fearful.’ However, this strategy carries inherent risks. Thorough research remains paramount. Diversification can also mitigate risk. Understanding the underlying factors of market sentiment is crucial. This knowledge empowers better decision-making. It helps avoid emotional reactions. Always consider your personal risk tolerance. Informed decisions are always the best approach.
The Crypto Fear & Greed Index at 44 underscores persistent market fear. This valuable tool synthesizes multiple data points. It offers a clear picture of prevailing market sentiment. Components like crypto volatility, trading volume, and Bitcoin dominance are key. They collectively shape the index’s reading. While fear persists, understanding its drivers is empowering. It allows investors to make informed choices. This index remains a vital indicator for navigating the dynamic cryptocurrency landscape. Stay informed to make strategic investment decisions.
Frequently Asked Questions (FAQs)
Q1: What does a Crypto Fear & Greed Index score of 44 signify?
A1: A score of 44 on the Crypto Fear & Greed Index indicates that the market is currently in a state of “fear.” This suggests investors are generally cautious. They are reluctant to make significant purchases. This sentiment often precedes periods of price stagnation or further declines.
Q2: How is the Crypto Fear & Greed Index calculated?
A2: The index combines six weighted factors. These include crypto volatility (25%), trading volume (25%), social media mentions (15%), surveys (15%), Bitcoin dominance (10%), and Google search volume (10%). Each factor reflects different aspects of market sentiment.
Q3: Can the Crypto Fear & Greed Index predict future price movements?
A3: The index does not directly predict prices. Instead, it measures current market sentiment. Historically, extreme fear often signals potential buying opportunities. Extreme greed can suggest an impending market correction. It serves as a psychological indicator, not a definitive price forecast.
Q4: Why is Bitcoin dominance a factor in the index?
A4: Bitcoin dominance helps gauge investor risk appetite. A rising dominance often indicates fear. Investors move capital from altcoins to Bitcoin, seeing it as a safer asset. Conversely, falling dominance can signal increasing confidence in altcoins. This suggests a higher tolerance for risk.
Q5: How should investors use the Crypto Fear & Greed Index?
A5: Investors should use the index as a supplementary tool. It provides insight into collective emotions. It should not be the sole basis for investment decisions. Combine its readings with fundamental and technical analysis. Always consider your personal financial goals and risk tolerance.
Related News
- Bitcoin Derivatives Tighten Dramatically as Options Open Interest Converges on Critical Price Levels
- Bitcoin’s Critical Showdown: Can Bulls Defend the $95K Fortress Against Mounting Pressure?
- Bitcoin Surges Toward $100K Milestone as Ordinals Protocol Sparks Unprecedented Blockchain Revolution