Ethereum Classic (ETCUSDT) experienced a volatile 24-hour trading session, with prices fluctuating between $21.46 and $22.05. Despite closing near the upper end of the range, bearish momentum dominated the market. Key technical indicators suggest a potential reversal, making this an intriguing period for traders and investors alike.
Ethereum Classic Price Action: Key Levels to Watch
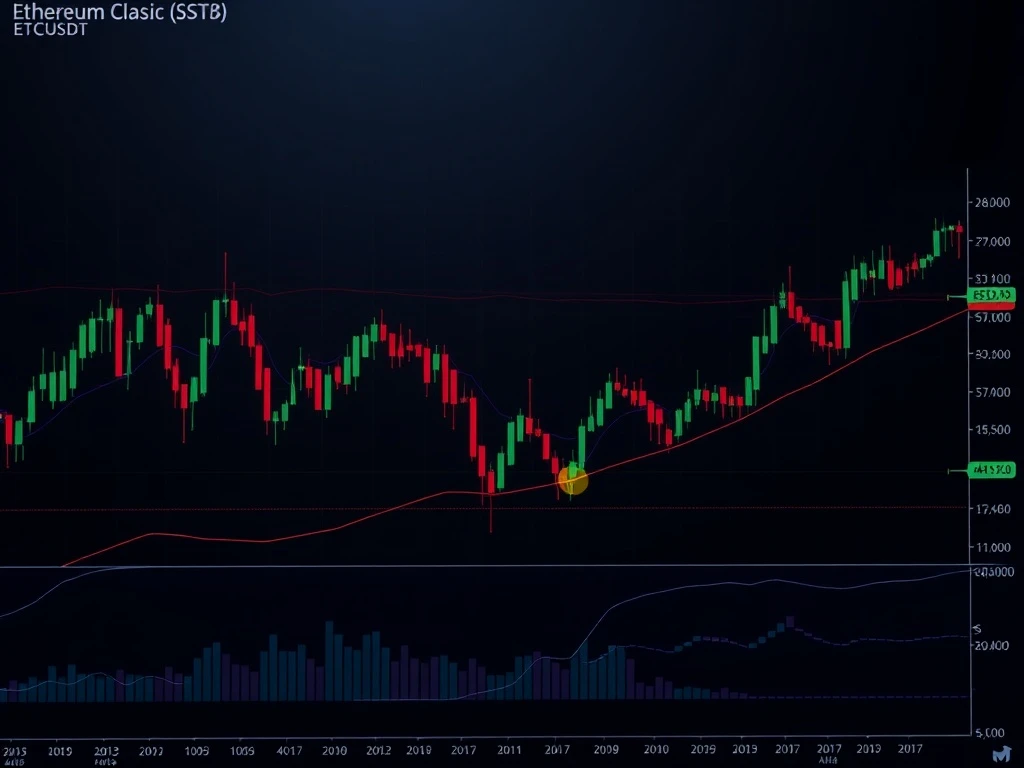
The 24-hour session for Ethereum Classic opened at $21.77 and closed at $21.55, with a high of $22.05 and a low of $21.46. Key resistance formed around $21.95–$22.05, while support levels developed near $21.65–$21.46. A bearish engulfing pattern emerged during the 19:30–19:45 ET window, signaling potential reversal.
Technical Indicators: Bearish Signals for ETCUSDT
- RSI: Briefly entered overbought territory near 70, suggesting profit-taking or correction ahead.
- MACD: Bearish crossover occurred during the 20:00–20:15 ET window.
- Moving Averages: Price remains above the 20-period MA but faces resistance near $21.95.
Volume and Volatility: Divergence Spotted
Volume spiked during the 19:30–20:30 ET window, coinciding with a sharp price decline. However, turnover failed to confirm the move, indicating possible divergence. The largest 15-minute volume spike occurred at 20:15 ET, with 10,804.6 ETC traded.
What’s Next for Ethereum Classic?
Ethereum Classic appears to be consolidating after a volatile 24-hour move. While short-term bullish momentum remains, bearish indicators suggest a potential pullback. Traders should monitor the $21.73–$21.95 range for confirmation of the next directional move.
FAQs
Q: What caused the bearish momentum in Ethereum Classic?
A: A bearish engulfing pattern and MACD crossover signaled potential reversal, while RSI entering overbought territory suggested profit-taking.
Q: What are the key support and resistance levels for ETCUSDT?
A: Resistance is near $21.95–$22.05, while support zones are around $21.65–$21.46.
Q: Is Ethereum Classic in a long-term bearish trend?
A: Daily moving averages indicate a broader bearish trend, with price below the 200-day MA.
Q: What should traders watch for in the next session?
A: Monitor volume and price action around $21.73–$21.95 for confirmation of the next move.
Related News
- Bitcoin Plummets Below $89,000: Analyzing the Sudden Market Correction
- Crypto Regulation 2025: PwC Declares Foundational Year for Global Framework Implementation
- Bitcoin Whale Transfer: Stunning $266 Million Move from Coinbase Institutional to Mystery Wallet