The cryptocurrency market often moves with dramatic swings. Recently, **ETH price** experienced a significant downturn. In just two weeks, Ethereum (ETH) dropped over 20%. Its value fell from $4,800 to below $4,000. This sharp decline has caught the attention of many investors and analysts. Crucially, a key technical indicator, the **Ethereum RSI**, has entered oversold territory. This development often signals a potential reversal. Therefore, understanding this indicator is vital for market participants.
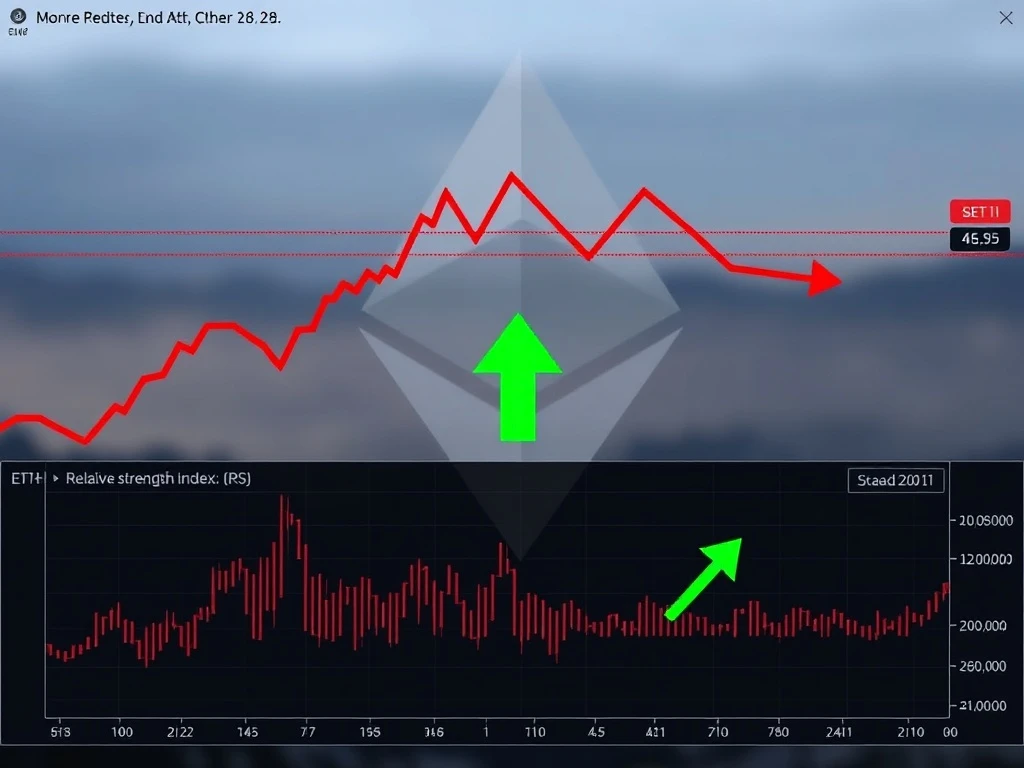
Understanding the Ethereum RSI Signal
The Relative Strength Index (RSI) is a momentum oscillator. It measures the speed and change of price movements. The RSI fluctuates between zero and 100. Traders use it to identify overbought or oversold conditions. A reading above 70 typically indicates an asset is overbought. Conversely, a reading below 30 suggests an asset is oversold. A reading of 14.5, as seen with ETH, is extremely low. This low reading strongly implies the asset is undervalued or experiencing excessive selling pressure. Historically, such extreme **oversold ETH** conditions frequently precede a price bounce.
According to TradingView data, the RSI on the ETH/USD four-hour chart plummeted dramatically. It fell from 82 to 14.5 on September 13. Such a steep decline is quite rare. This swift drop highlights the intensity of the recent selling. However, it also presents a potential opportunity. Many analysts view this as a classic contrarian signal. It suggests that sellers may be exhausted. Buyers could soon step in, potentially driving the price higher.
The Recent ETH Price Plunge: A Deeper Look
Ethereum’s recent price action has been volatile. The 20% drop wiped out significant gains. Many factors contribute to such market movements. Broader market sentiment often plays a role. Profit-taking after a strong rally can also cause price corrections. The swiftness of this particular decline is notable. It indicates strong selling pressure. Yet, it also pushed the **Ethereum RSI** into a critical zone. This zone is often associated with imminent price reversals. Investors are now closely watching for signs of stabilization. They hope for a recovery in the near future.
A price drop of this magnitude can be concerning. However, technical indicators help provide perspective. The RSI’s move into oversold territory offers a glimmer of hope. It suggests the selling might be overdone. Therefore, a bounce could be on the horizon. This technical signal provides a data-driven perspective. It helps cut through emotional market reactions. Furthermore, it gives traders a framework for making informed decisions.
Is a Short-Term Bottom Forming for ETH?
Multiple analysts cite the extreme RSI reading. They suggest it likely signals a **short-term bottom** for Ethereum. When an asset’s RSI drops so sharply and deeply, it often means selling pressure has reached its peak. At this point, fewer sellers remain. The likelihood of new buyers entering the market increases. This dynamic can lead to a reversal. A short-term bottom does not necessarily mean the end of all bearish sentiment. However, it implies a temporary halt to the downtrend. A period of consolidation or a modest rebound usually follows.
Investors often look for confluence of signals. The oversold RSI is one strong indicator. Other factors, like trading volume or candlestick patterns, can provide further confirmation. A bounce from this level would be a positive sign. It would demonstrate resilience in the **ETH price**. Conversely, a failure to bounce might indicate deeper underlying issues. Therefore, market participants remain cautious but optimistic. They await further price action to confirm the signal.
Historical Precedent for Oversold ETH Reversals
History often rhymes in financial markets. Examining past instances of **oversold ETH** conditions provides valuable context. Ethereum has seen similar RSI plunges before. Many times, these events led to significant price recoveries. For example, during previous market corrections, a deep RSI reading often marked the low point. The price then typically consolidated before initiating an upward trend. This historical pattern lends credibility to the current signal. It suggests that the current situation is not entirely unprecedented. Rather, it aligns with established technical analysis principles.
However, past performance does not guarantee future results. Each market cycle has unique characteristics. Still, the consistency of RSI signals is compelling. It offers a framework for anticipating market shifts. Traders often use these historical precedents. They inform their strategies and risk management. This approach helps them navigate volatile periods. Ultimately, it allows for more strategic entry and exit points.
Broader Implications for the Crypto Market Bottom
Ethereum is a major cryptocurrency. Its price movements often influence the broader market. Therefore, a potential **short-term bottom** for ETH could have wider implications. If Ethereum stabilizes and begins to recover, other altcoins might follow. This ripple effect is common in the crypto ecosystem. Bitcoin’s performance also significantly impacts altcoins. However, ETH’s independent technical signals are also crucial. They offer unique insights into market dynamics. A strong ETH recovery could boost overall market confidence. It might even signal a broader **crypto market bottom** for several assets.
Market participants constantly seek signs of a market bottom. This helps them identify optimal buying opportunities. The current **Ethereum RSI** reading is one such signal. It contributes to the overall market narrative. While not definitive on its own, it adds weight to the argument for a potential rebound. Therefore, watching Ethereum’s performance closely is essential. Its recovery could pave the way for a more general market upturn. This would benefit many digital assets.
Navigating Volatility: Investor Strategies and Outlook
In volatile markets, strategic decision-making is paramount. The current **oversold ETH** signal presents a complex scenario. Some investors might view this as a buying opportunity. They believe the price is temporarily depressed. Others might prefer to wait for further confirmation. They want to see clear signs of a sustained uptrend. Both approaches have merit. It depends on individual risk tolerance and investment horizons. Diversification remains a key strategy. It helps mitigate risks during uncertain times. Moreover, staying informed about market news and technical analysis is crucial.
The current outlook suggests caution combined with optimism. The extreme RSI reading is a powerful signal. However, the market remains susceptible to external factors. Macroeconomic news, regulatory changes, and institutional adoption can all influence **ETH price**. Therefore, a comprehensive approach is best. This involves combining technical indicators with fundamental analysis. It helps investors make well-rounded decisions. Ultimately, patience and discipline are key to navigating these market conditions successfully.
In conclusion, the **Ethereum RSI** entering oversold territory is a significant event. It follows a sharp 20% drop in **ETH price**. This technical signal often points to a **short-term bottom**. While not a guarantee, historical data supports this interpretation. The potential for **oversold ETH** to trigger a rebound offers hope for investors. It also has implications for the broader **crypto market bottom**. Monitoring Ethereum’s price action in the coming days will be crucial. It will confirm whether this crucial signal indeed marks a turning point for the asset.
Frequently Asked Questions (FAQs)
Q1: What does it mean when the Ethereum RSI enters oversold territory?
A1: When the **Ethereum RSI** enters oversold territory (typically below 30), it suggests that ETH has been subjected to intense selling pressure and its price may be undervalued. This condition often precedes a price rebound or a period of consolidation, indicating that sellers might be exhausted.
Q2: How accurate is the RSI in predicting a short-term bottom for ETH?
A2: The RSI is a widely used and generally reliable indicator for identifying potential reversals. While it doesn’t guarantee a bottom, extreme oversold readings for **oversold ETH** have historically often coincided with short-term bottoms, making it a strong signal for traders to consider.
Q3: What caused the recent 20% drop in ETH price?
A3: The article mentions a more than 20% price drop from $4,800 to under $4,000 over two weeks. This decline was likely influenced by broader market corrections, profit-taking after previous rallies, and general market sentiment, pushing the **ETH price** lower.
Q4: Does a short-term bottom for Ethereum mean the entire crypto market will recover?
A4: A **short-term bottom** for Ethereum could certainly signal a broader recovery. As a major cryptocurrency, ETH’s movements often influence other altcoins. If ETH stabilizes and begins to rise, it may boost confidence and lead to a more general **crypto market bottom** for other assets as well.
Q5: What should investors do when ETH’s RSI is oversold?
A5: Investors often view an **oversold ETH** RSI as a potential buying opportunity. However, it is advisable to combine this signal with other technical analysis tools and fundamental research. Consider your risk tolerance and investment strategy, and avoid making decisions based on a single indicator.
Related News
- Elon Musk Davos 2025: The Stunning Vision of AI, Robots, and Space Reshaping Our World Economy
- Bitwise Bitcoin Gold ETF Launches Revolutionary BPRO Fund for Diversified Digital-Asset Strategy
- Changpeng Zhao’s Bold Prediction: How Cryptocurrency Could Revolutionize Retirement Planning Amid AI Disruption