Are you tracking the latest movements in Ether.fi (ETHFIUSDT)? On July 30, 2025, the cryptocurrency showed intriguing patterns that every trader should know. From key support levels to bearish divergences, here’s what you need to watch.
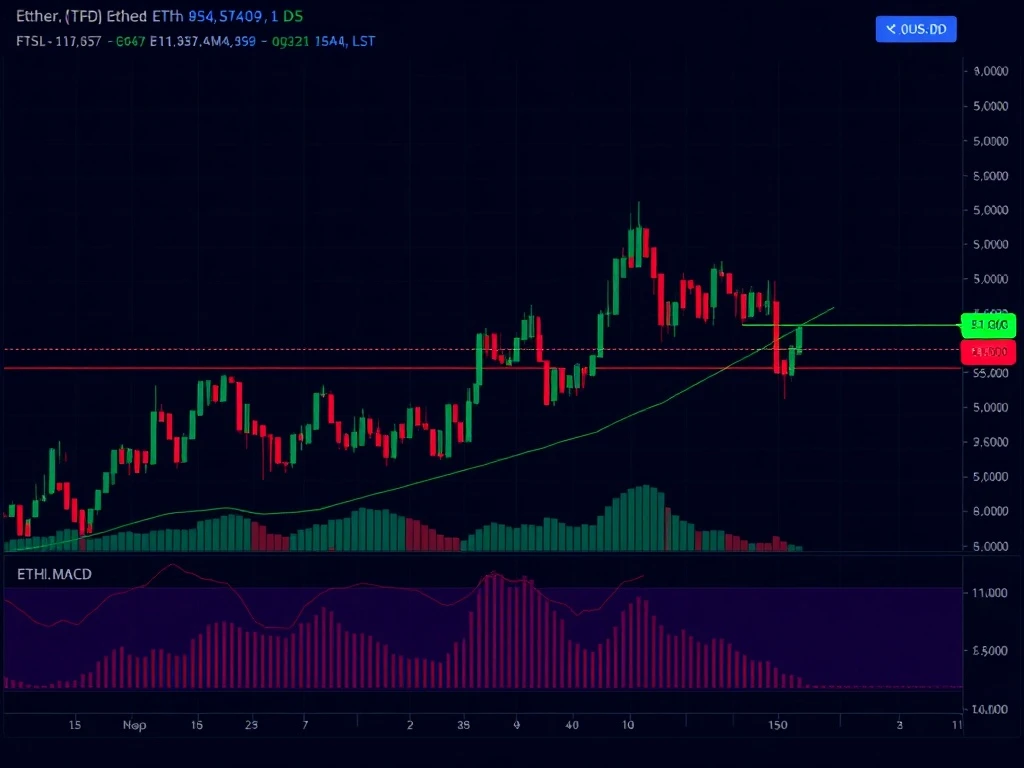
Ether.fi (ETHFIUSDT) Price Action Overview
Ether.fi (ETHFIUSDT) opened at $1.159 and reached a high of $1.226 before closing at $1.138. The 24-hour trading session revealed a bearish reversal bias, with resistance at $1.191–$1.196 tested multiple times. Key takeaways:
- 24-hour range: $1.13–$1.226
- Final 15-minute close: $1.138
- Total volume: 35,205,970.0
- Turnover: $38,191,633.5
Crypto Trading Signals: What the Indicators Reveal
Technical indicators provided mixed signals for Ether.fi (ETHFIUSDT):
- RSI & MACD: Overbought conditions during the midday rally, but momentum faded.
- Bollinger Bands: Volatility expanded midday, then contracted into consolidation.
- Moving Averages: Bearish crossover on the 15-minute chart, but longer-term bias remains bullish.
Key Support and Resistance Levels for Ether.fi
Traders should monitor these critical levels:
| Level | Price | Significance |
|---|---|---|
| Support | $1.138 | Tested multiple times, crucial for downside protection |
| Resistance | $1.191–$1.196 | Strong cluster, failed breakout attempts |
What’s Next for Ether.fi (ETHFIUSDT)?
The market shows signs of consolidation. A break below $1.138 could trigger further declines, while a sustained move above $1.196 may revive bullish momentum. Traders should watch volume trends for confirmation.
FAQs
Q: What caused the midday rally in Ether.fi (ETHFIUSDT)?
A: The rally was driven by strong buying pressure, with volume peaking at 717,571.7 at $1.198.
Q: Is Ether.fi (ETHFIUSDT) in a bullish or bearish trend?
A: The longer-term trend remains bullish, but short-term indicators suggest a pullback or consolidation.
Q: What are the key levels to watch?
A: $1.138 (support) and $1.191–$1.196 (resistance) are critical for directional bias.
Q: How reliable are the bearish divergence signals?
A: The divergence between price and volume suggests weakening momentum, but confirmation is needed for a strong downtrend.
Related News
- Bitcoin Price Prediction: Cathie Wood Reveals Why the Rally Will Resume After Selling Pressure Dissipates
- On-Chain Vault Market Poised to Double: Bitwise Reveals Stunning $12 Billion Growth Projection
- Cryptocurrency Payments Surge: 85% of Business Leaders Predict Widespread Adoption Within 5 Years