Are you tracking Ether.fi (ETHFIUSDT) in the volatile crypto market? On 2025-07-31, ETHFIUSDT showed intriguing price movements, offering both opportunities and risks for traders. Let’s dive into the key trends and technical indicators to help you make informed decisions.
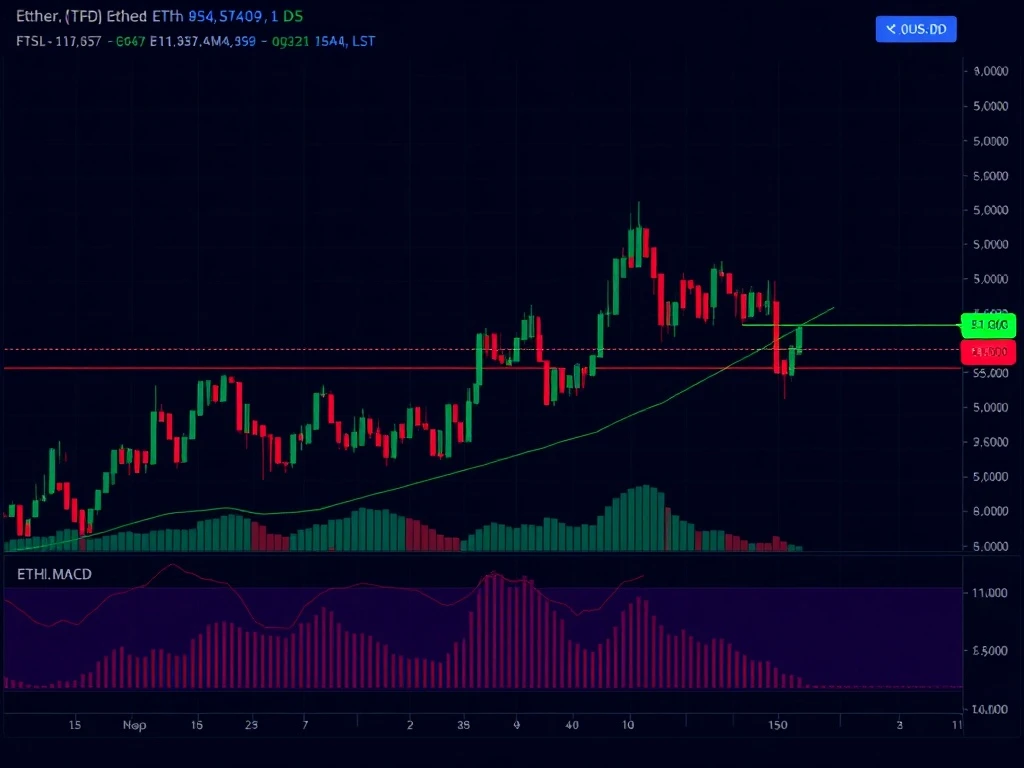
Ether.fi (ETHFIUSDT) Price Performance
Ether.fi opened at $1.138 and closed at $1.119, with a high of $1.196 and a low of $1.110. The session saw a sharp rally post-midnight, followed by a bearish consolidation. Here’s a quick breakdown:
- Opening Price: $1.138
- Closing Price: $1.119
- 24-Hour High/Low: $1.196 / $1.110
- Volume: 5.4M ETHFI ($5.9M turnover)
Technical Analysis: Key Indicators for ETHFIUSDT
Technical indicators provide deeper insights into Ether.fi’s market behavior:
- RSI & MACD: RSI dropped from overbought (70+) to neutral (45–55), while MACD turned negative, signaling weakening bullish momentum.
- Bollinger Bands: Volatility expanded early, with price retreating to the lower band by close.
- Moving Averages: Price closed below 20-period and 50-period MAs, reinforcing a bearish bias.
Ether.fi Trading Strategy: What’s Next?
With key support at $1.110, a break below could trigger a deeper pullback. Traders should monitor:
- Fibonacci Levels: $1.171 (38.2%), $1.159 (50%), and $1.147 (61.8%) as potential reversal zones.
- Volume Trends: Early volume spikes confirmed the rally, but declining volume suggests weakening conviction.
Conclusion
Ether.fi (ETHFIUSDT) faces critical support tests, with technical indicators hinting at further downside. Stay vigilant and use volume and Fibonacci levels to guide your trades.
FAQs
1. What caused Ether.fi’s early rally on 2025-07-31?
The rally was driven by strong volume in the early hours, likely due to market sentiment or external catalysts.
2. Is Ether.fi in a bearish trend?
Yes, price closed below key moving averages, and MACD/RSI suggest bearish momentum.
3. What’s the next support level for ETHFIUSDT?
$1.110 is critical; a break below could target $1.100.
4. How reliable are Bollinger Bands for Ether.fi?
They indicate volatility shifts, but combine with RSI/MACD for confirmation.
Related News
- Nigeria Crypto Regulation Faces ‘Anti-Innovation’ Backlash Over Crushing Capital Requirements
- Lens Protocol Control Shifts: Aave’s Strategic Handover to Mask Network Sparks Web3 Evolution
- Upbit Stellar Upgrade: Critical Service Suspension for XLM, AQUA, and MOBI Assets Announced