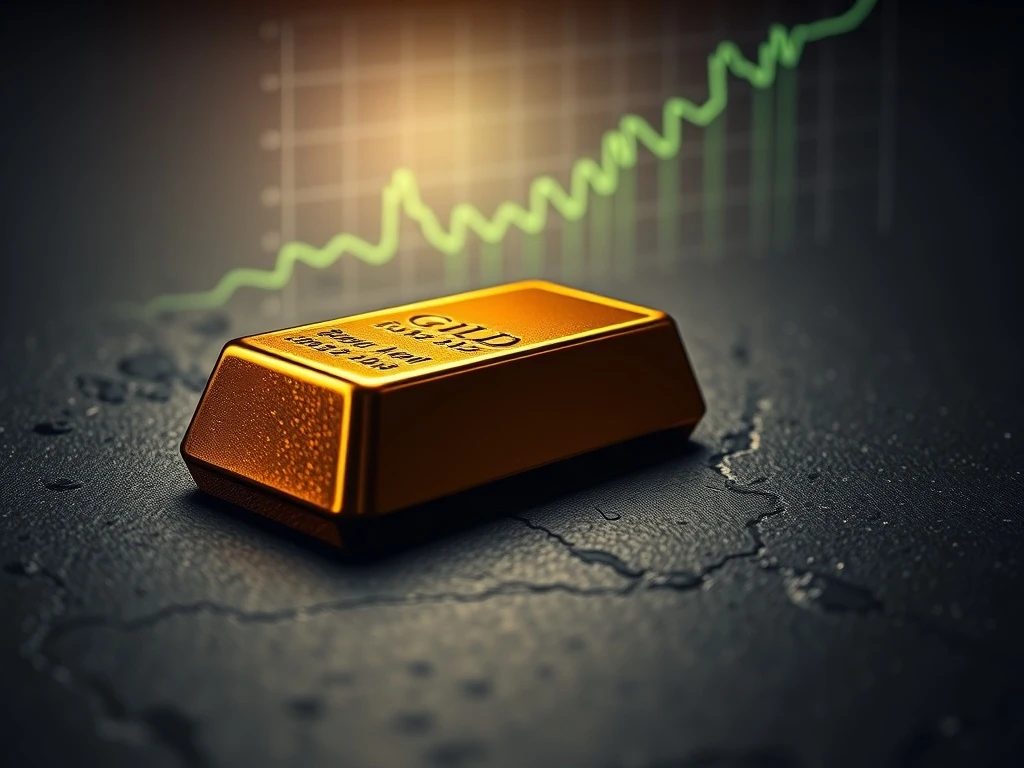
In a landmark move for global markets, the spot price of gold has decisively broken through the $5,400 per ounce barrier, setting a stunning new all-time high and sending shockwaves through financial circles worldwide. This unprecedented surge, recorded in early 2025, represents a monumental shift in the valuation of the world’s premier safe-haven asset. Consequently, investors and analysts are now scrutinizing the complex confluence of macroeconomic forces driving this historic rally.
Gold Price Achieves Unprecedented Milestone
The London Bullion Market Association (LBMA) confirmed the benchmark gold price reached $5,402.75 per ounce during Asian trading hours. This figure shatters the previous record, which had stood for just over a year. Market data from major exchanges shows consistent upward pressure on the metal throughout the quarter. Trading volumes have spiked significantly, indicating broad institutional and retail participation in the rally. Furthermore, open interest in gold futures contracts has expanded, signaling sustained bullish sentiment.
Several key factors are converging to propel gold to these dizzying heights. Primarily, persistent global inflationary pressures continue to erode the purchasing power of fiat currencies. Central banks, notably across emerging markets, have maintained a robust pace of gold acquisitions to diversify reserve assets. Simultaneously, geopolitical tensions in multiple regions have amplified demand for non-sovereign, tangible stores of value. Market volatility in both equity and bond markets has also redirected capital toward perceived stability.
The Macroeconomic Backdrop for the Rally
Economic data from the past eighteen months provides critical context for this gold price surge. Real interest rates, a traditional headwind for gold, have remained negative or low in many major economies even after policy adjustments. The U.S. dollar index has shown unusual volatility, weakening against a basket of currencies and enhancing gold’s appeal for international buyers. Supply-side constraints in the mining sector, coupled with rising production costs, have further tightened the physical market.
Analyzing the Drivers Behind the Surge
The journey to $5,400 is not an isolated event but the culmination of a sustained bull market. To understand the momentum, we must examine the primary catalysts. First, central bank demand has been a structural pillar. According to reports from the World Gold Council, official sector purchases have exceeded 1,000 tonnes annually for three consecutive years. This trend reflects a strategic move away from over-reliance on specific foreign exchange reserves.
- Inflation Hedging: Investors globally are allocating to gold as a direct hedge against currency debasement.
- Geopolitical Safe Haven: Ongoing conflicts and trade disputes have fueled risk-off capital flows.
- Technical Breakout: The breach of key psychological resistance levels triggered algorithmic and momentum buying.
- Weakness in Alternatives: Volatility in cryptocurrency markets and real estate has renewed focus on traditional stores of value.
Moreover, retail investment demand has surged through channels like physically-backed gold ETFs and sovereign mint products. Sales of gold bars and coins have hit multi-year highs in North America, Europe, and Asia. This broad-based demand creates a resilient price floor and suggests the rally has deep-rooted public confidence.
Historical Context and Market Comparisons
Placing the $5,400 milestone in historical perspective reveals the scale of the move. The following table compares key gold price milestones over the past two decades, adjusted for inflation to 2025 dollars.
| Year | Nominal Price (USD/oz) | Inflation-Adjusted Price (2025 USD) | Key Catalysts |
|---|---|---|---|
| 2011 | ~$1,900 | ~$2,700 | Post-2008 crisis, Eurozone debt fears |
| 2020 | ~$2,070 | ~$2,450 | COVID-19 pandemic, massive monetary stimulus |
| 2023 | ~$2,400 | ~$2,550 | Persistent inflation, banking sector stress |
| 2025 | $5,400+ | $5,400+ | Multi-factor convergence (current rally) |
This data illustrates that the current price is not merely a nominal record but a real, inflation-adjusted high. The pace of the ascent from the 2023 base is notably steeper than previous cycles. Compared to other asset classes, gold has significantly outperformed global equities and aggregate bonds over the same period. Its correlation with traditional risk assets has broken down, reaffirming its unique portfolio role.
Expert Analysis on Sustainability
Market strategists offer varied perspectives on the rally’s longevity. Some analysts point to stretched speculative positioning in futures markets as a potential near-term risk. Others argue that the fundamental drivers—like de-dollarization trends and fiscal deficits—are long-term and structural. Mining analysts note that while high prices incentivize new exploration, the lead time from discovery to production is typically 5-10 years, limiting immediate supply response.
Implications for Investors and the Global Economy
The record gold price carries profound implications. For individual investors, it alters the risk-reward calculus for portfolio allocation. Financial advisors are reviewing standard allocation models, which often recommended 5-10% in gold. For nations, the value of national reserves has swelled, impacting balance sheet strength. Conversely, countries that are net importers of gold face increased pressure on trade balances.
In the broader economy, the high price signals deep-seated concerns about monetary stability and wealth preservation. It acts as a barometer of systemic anxiety. The jewelry industry, a major consumer of physical gold, is adapting to higher input costs through design changes and promotional strategies. Meanwhile, recycling rates of old gold jewelry have increased, adding to above-ground supply.
Conclusion
The breach of the $5,400 level for spot gold marks a definitive chapter in financial history. This new all-time high reflects a powerful synthesis of inflationary fears, geopolitical uncertainty, and strategic asset allocation shifts. While market corrections are inevitable, the underlying demand drivers appear robust and multifaceted. The gold price surge therefore serves as a critical indicator of the current global economic climate, emphasizing a collective search for security and tangible value in an increasingly digital and volatile world.
FAQs
Q1: What exactly does ‘spot gold’ price mean?
The spot price is the current market price for immediate delivery and payment of gold. It serves as the global benchmark for pricing physical gold, gold derivatives, and jewelry.
Q2: How does this price affect my gold jewelry or coins?
The intrinsic melt value of your physical gold items is directly tied to the spot price. A higher spot price means the raw gold content in your jewelry, coins, or bars is worth more in the market.
Q3: Are gold mining stocks a good way to invest during this rally?
Gold mining stocks often offer leveraged exposure to the gold price, meaning they can rise (or fall) more sharply. However, they also carry company-specific risks like management, costs, and operational issues, unlike direct physical gold or ETFs.
Q4: What typically causes a gold price rally to end?
Historically, rallies can pause or reverse due to a significant rise in real interest rates, a major strengthening of the US dollar, a resolution of geopolitical tensions, or a shift in central bank policy from buying to selling.
Q5: Is it too late to buy gold at $5,400?
Market timing is extremely difficult. Many analysts view gold as a long-term strategic holding for diversification and wealth preservation, not a short-term trade. The decision should align with your individual financial goals, risk tolerance, and existing portfolio allocation.
Related News
- Moltbot AI Agent: The Revolutionary Transformation from Clawdbot That’s Captivating Tech Media
- South Korea’s Crypto Regulation Crisis: Ruling Party Fiercely Opposes FSC’s Exchange Stake Limit Proposal
- Gold Price Shatters $5.5K Barrier, Setting Unprecedented Consecutive Highs