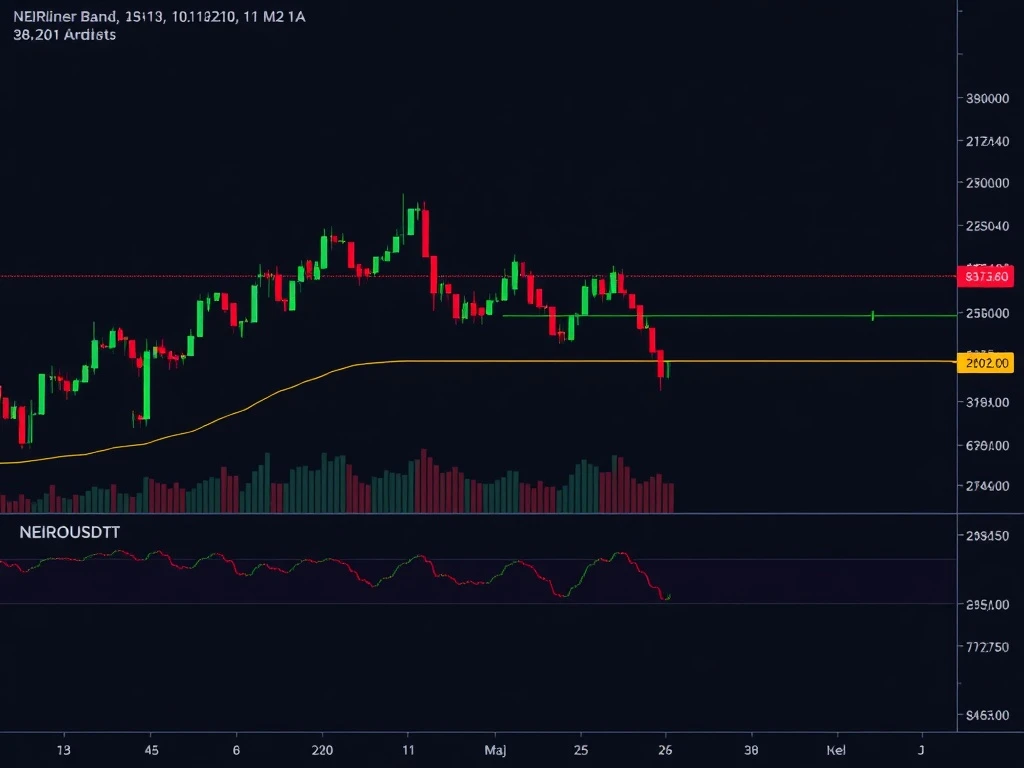
NEIROUSDT traders faced a turbulent 24-hour session as the Ethereum-based pair dropped 6.3%, testing crucial support levels. Our technical deep dive reveals whether this is a temporary pullback or the start of a steeper decline.
NEIROUSDT Price Action: Breakdown From Consolidation
The session opened at 0.00045008 before plunging to 0.00042046, with several key developments:
- Failed bullish engulfing pattern at 0.0004435
- Bearish flag formation signaling continuation
- Volume spikes during downward moves
Technical Indicators Paint Bearish Picture for NEIROUSDT
Multiple indicators confirm the negative momentum:
| Indicator | Observation |
|---|---|
| RSI | Bearish divergence, oversold but no rebound |
| MACD | Turned negative after brief positive divergence |
| Moving Averages | 20-period MA acting as resistance |
Volatility Expansion: Bollinger Bands Signal Turbulence Ahead
The widening Bollinger Bands after a consolidation phase suggest increased volatility. With price hugging the lower band, traders should prepare for either:
- A technical bounce from oversold conditions
- Further breakdown if support fails
Crypto Trading Strategy: Key Levels to Watch
Critical price zones for NEIROUSDT:
- Resistance: 0.000441 (20-period MA)
- Support: 0.000430 and 0.000425
- Breakdown target: 0.000424 (78.6% Fibonacci)
Conclusion: Caution Warranted in NEIROUSDT Trading
The weight of evidence suggests bearish control, though oversold conditions may prompt short-term bounces. Traders should watch volume patterns and indicator divergences for potential trend reversals.
FAQs
Q: What caused NEIROUSDT’s 6.3% drop?
A: Technical breakdown from consolidation, confirmed by bearish indicators and rising volume during declines.
Q: Is NEIROUSDT oversold?
A: RSI dipped to 30-35 but failed to generate meaningful bounce, suggesting possible further downside.
Q: What’s the significance of the Bollinger Band expansion?
A: It signals increased volatility after a quiet period, often preceding significant moves.
Q: Where are the key support levels?
A: Immediate support at 0.000430, with stronger support at 0.000425 and 0.000424.
Related News
- Matcha Meta Exploit: Devastating $16.8M DEX Aggregator Hack Exposes SwapNet Vulnerability
- Bermuda’s Onchain Transformation: A Revolutionary Blueprint or Regulatory Gamble?
- Binance Delisting Shakes Crypto Markets: 21 Spot Trading Pairs to Vanish on January 27