Ripple (XRPUSDT) faced a bearish session on July 31, 2025, with price breaking below key support levels. This technical analysis dives into the 24-hour price action, volume trends, and key indicators to help traders navigate the XRP market.
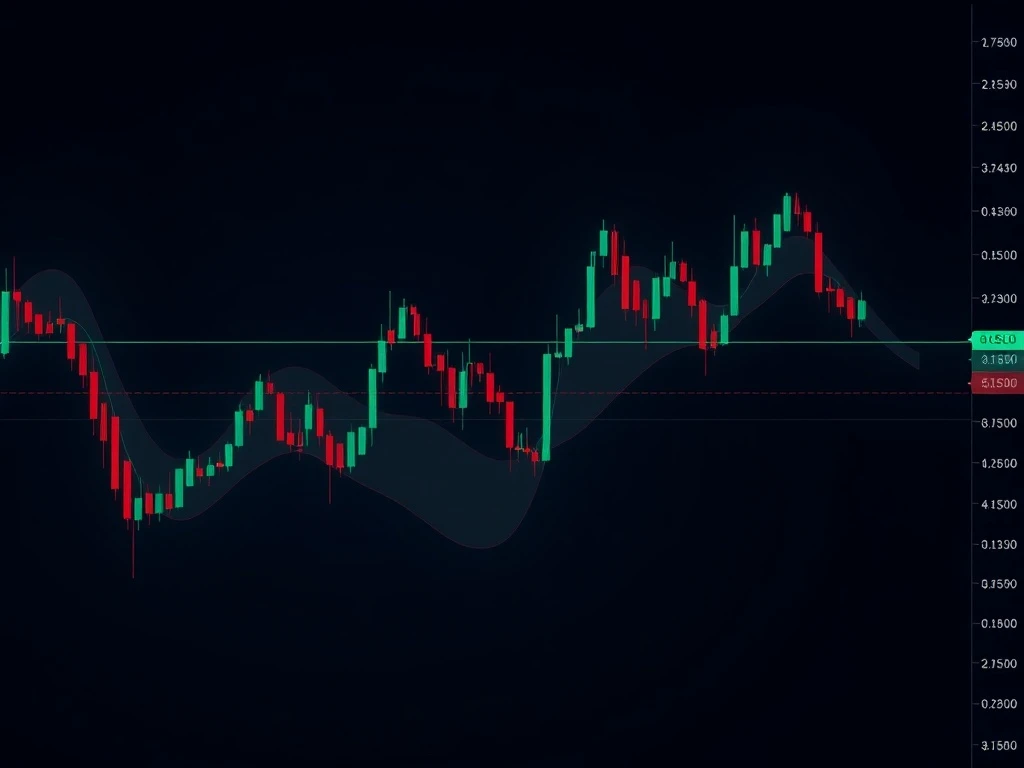
Ripple (XRPUSDT) Price Action Breakdown
XRPUSDT opened at $3.149, reaching a high of $3.1621 and a low of $3.0492 before closing at $3.1398. The 24-hour trading volume was $48.8 million, reflecting heightened activity during the selloff. Key observations:
- Bearish engulfing pattern confirmed the downtrend.
- Doji candle signaled indecision but was followed by further declines.
- Key support levels at 3.11 (38.2% Fib) and 3.13 (61.8% Fib).
Technical Indicators: RSI and MACD Signal Oversold Conditions
The MACD line crossed below the signal line, confirming bearish momentum. RSI dipped to ~32, indicating oversold conditions. However, no clear divergence suggests any bounce may be short-lived.
Bollinger Bands and Volume Analysis
Volatility increased as Bollinger Bands widened, with price near the lower band. Volume spiked during the selloff but declined afterward, hinting at potential consolidation.
Fibonacci Retracement Levels to Watch
Key Fibonacci levels for the 15-minute chart:
- 3.11 (38.2%)
- 3.13 (61.8%)
- 3.15 (100%)
A retest of 3.13–3.15 could provide a near-term floor or trigger a short-term rally.
What’s Next for Ripple (XRPUSDT)?
XRPUSDT may test the 3.11–3.13 support range in the next 24 hours. A break below 3.11 could trigger further declines, while a sustained close above 3.15 may signal a near-term bottom.
Frequently Asked Questions (FAQs)
Q: Is Ripple (XRP) oversold?
A: Yes, the RSI at ~32 suggests oversold conditions, but no divergence yet indicates a weak rebound.
Q: What are the key support levels for XRPUSDT?
A: 3.11 (38.2% Fib) and 3.13 (61.8% Fib) are critical support zones.
Q: Did volume confirm the bearish move?
A: Yes, volume spiked during the selloff, confirming bearish sentiment.
Q: What could trigger a rebound in XRPUSDT?
A: A retest of 3.13–3.15 with strong volume and RSI reversal could signal a bounce.