Is SHIB on the verge of a massive breakout? Shiba Inu (SHIB) is currently consolidating within a symmetrical triangle pattern, and analysts are buzzing about a potential 17x surge to $0.00023. With whale activity increasing and exchange supply dropping, this could be the perfect storm for a bullish run.
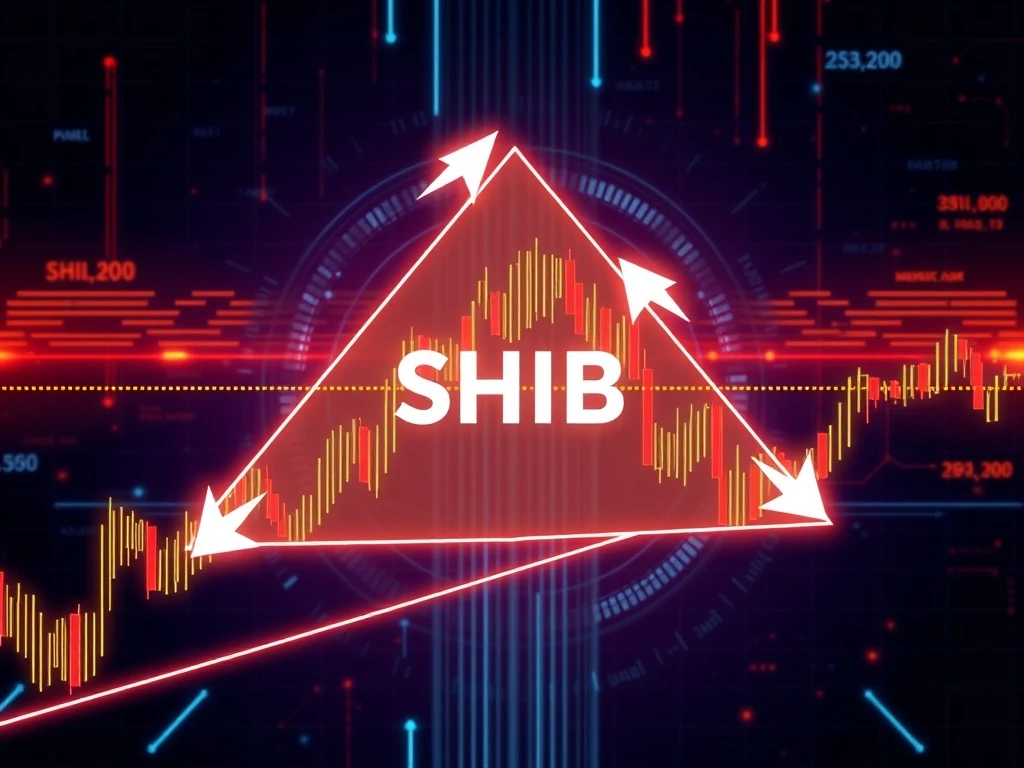
SHIB’s Symmetrical Triangle: What Does It Mean?
The symmetrical triangle pattern is a technical analysis formation characterized by converging trendlines of higher lows and lower highs. For SHIB, this pattern suggests:
- A period of consolidation before a potential breakout
- Equal pressure from buyers and sellers
- Imminent volatility as the price approaches the apex
Why Analysts Predict a 17x Gain for SHIB
The ambitious $0.00023 target represents a 17x increase from SHIB’s current price of $0.00001307. This projection is based on:
| Factor | Details |
|---|---|
| Pattern Height | Measured move from triangle base |
| Whale Accumulation | 109.69 billion SHIB held by large investors |
| Exchange Supply | 277.37 trillion SHIB on exchanges (decreasing) |
Key Indicators Supporting the SHIB Breakout
Several on-chain metrics suggest growing confidence in SHIB:
- Whale holdings increased from 105 billion to 109.69 billion SHIB
- Declining exchange reserves indicate hodling mentality
- Compressed volume often precedes significant price movements
What Could Derail SHIB’s Bullish Scenario?
While the outlook appears positive, traders should watch for:
- Failure to hold triangle support
- Sudden increase in exchange deposits
- Broader market downturns affecting altcoins
The coming days will be crucial for SHIB as it tests key technical levels. A confirmed breakout could validate the ambitious 17x target, while a breakdown might lead to further consolidation. With strong fundamentals and technicals aligning, SHIB holders have reason to be optimistic.
Frequently Asked Questions
Q: What is a symmetrical triangle pattern?
A: It’s a technical chart pattern where price converges between two trendlines, typically indicating a continuation of the prior trend after breakout.
Q: How reliable is the 17x gain prediction for SHIB?
A: While technical analysis provides probabilities, predictions aren’t guarantees. The 17x target is based on the pattern’s measured move and requires confirmation.
Q: What’s driving whale accumulation of SHIB?
A: Potential factors include upcoming ecosystem developments, low price entry points, and anticipation of broader market recovery.
Q: When might the SHIB breakout occur?
A: Breakouts typically happen when price reaches the triangle’s apex (2/3 to 3/4 of pattern completion), suggesting timing could be within weeks.