Stellar (XLM) has suddenly lost its bullish momentum, plunging below the critical 10-day SMA and sparking fears of a deeper correction. This 6% price drop comes after a promising rally, leaving investors wondering: is this just a temporary setback or the start of a prolonged downtrend?
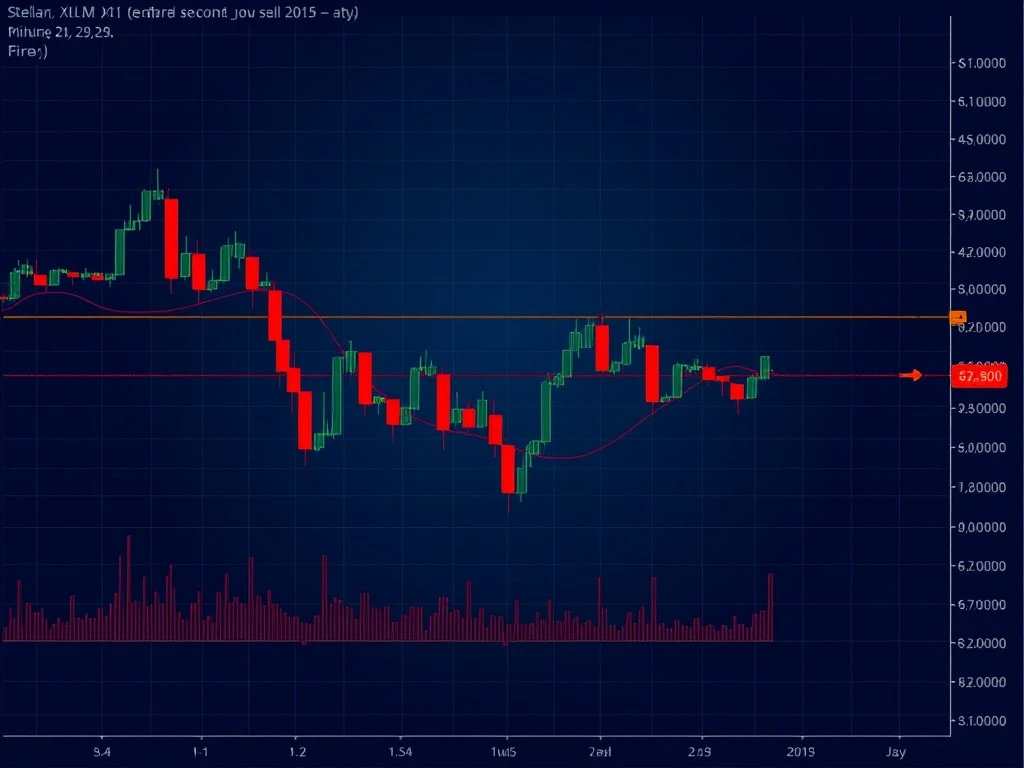
Stellar XLM Technical Breakdown: Why the 10-Day SMA Matters
The 10-day simple moving average (SMA) is a crucial short-term indicator that traders watch closely. For XLM, this level had provided strong support during its recent climb from $0.30 to $0.50. The breakdown below this level, accompanied by higher selling volume, suggests a significant shift in market sentiment.
Bearish Momentum Builds: What the Indicators Show
- Price dropped 6% in a single day, with a 7-day decline reaching 8%
- Bull-Bear Power (BBP) indicator turned negative (-0.0182)
- Red bars replacing previous green bars on momentum indicators
Expert Analysis on Stellar XLM’s Future Price Action
Technical analysts are divided on XLM’s next moves:
| Analyst | View | Key Levels |
|---|---|---|
| Ali Martinez | Bearish below SMA | $0.45 resistance |
| Javon Marks | Long-term bullish potential | $0.79783 target |
| Peter Brandt | Range-bound risk | Must hold $0.22 |
Cryptocurrency Market Context: Not Just an XLM Problem
The current pullback reflects broader challenges in the cryptocurrency sector, with XRP showing similar weakness. However, Stellar’s unique use case in cross-border payments and its growing ecosystem could provide fundamental support during this technical correction.
Actionable Insights for XLM Investors
Key levels to watch:
- Immediate resistance at $0.45
- Critical support at $0.42
- Long-term breakout level at $0.50
Monitoring on-chain metrics like wallet activity and transaction volume will be crucial for identifying potential recovery signals.
FAQs About Stellar (XLM) Price Drop
Q: How significant is breaking below the 10-day SMA?
A: It’s a concerning short-term signal that often precedes further downside, especially when accompanied by high volume.
Q: Could XLM really reach $8 as some analysts suggest?
A: While theoretically possible in a massive bull market, such targets are highly speculative and would require breaking multiple resistance levels.
Q: What’s the most important support level to watch now?
A: The $0.42-$0.45 range is critical. A break below could test $0.30 support.
Q: Is this a good time to buy XLM?
A: It depends on your risk tolerance. Conservative investors might wait for confirmation of a new uptrend, while aggressive traders could see this as a buying opportunity.
Related News
- Bitcoin Price Plummets Below $78,000: Market Analysis Reveals Critical Support Levels
- Crypto Futures Liquidations Unleash $411M Market Shakeout as Long Positions Dominate Exits
- XRP Price Prediction: Ripple’s David Schwartz Decodes the Realistic Odds of Hitting $50-$100