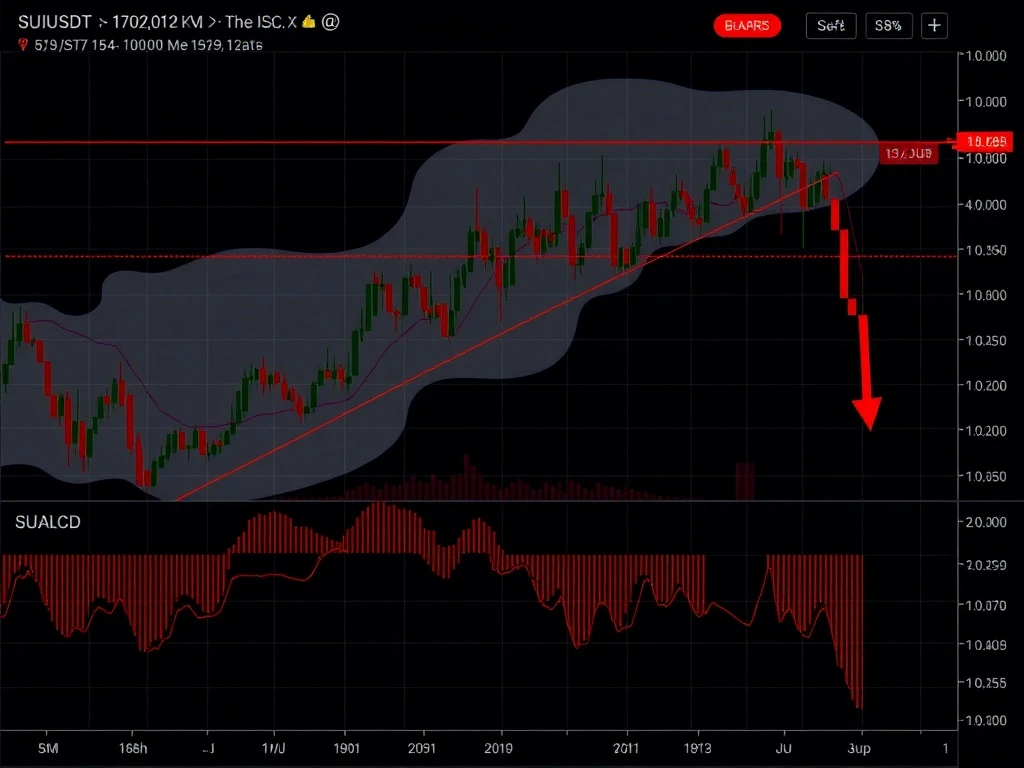
The SUIUSDT pair has experienced a dramatic 7.1% drop in just 24 hours, sending shockwaves through the crypto trading community. This sharp decline highlights the volatile nature of cryptocurrency markets and the importance of understanding key technical indicators.
SUIUSDT’s Bearish Breakdown: What Happened?
The trading session opened at $4.0927 but quickly turned south, breaking through multiple support levels:
- Key psychological levels at $4.00 and $3.90 were shattered
- A large bearish engulfing pattern formed on the 15-minute chart
- Price closed at $3.7984 after hitting a low of $3.7697
Crypto Trading Indicators Confirm Downtrend
Technical analysis shows strong bearish signals across multiple indicators:
| Indicator | Signal |
|---|---|
| Moving Averages | Price below 20, 50, 100, and 200-day MAs |
| MACD | Sharp negative crossover, staying below signal line |
| RSI | Dropped below 30 without price reversal |
Market Volatility Reaches Extreme Levels
The late afternoon session saw:
- Volume spiked to $93,703,327.60
- Bollinger Bands expanded significantly
- Price broke below the lower Bollinger Band
Fibonacci Retracement Points to Key Levels
Traders should watch these critical Fibonacci levels:
- 61.8% retracement at $3.97 as potential resistance
- Recent low of $3.7697 as next support
- Daily chart shows bearish alignment of Fibonacci levels
Actionable Crypto Trading Insights
For traders navigating this bearish SUIUSDT market:
- Monitor $3.7697 for potential support bounce
- Watch for rejection at $3.97 Fibonacci resistance
- Consider short positions while indicators remain bearish
- Set tight stop-losses due to high volatility
The SUIUSDT pair demonstrates how quickly market conditions can change in crypto trading. While the current trend appears strongly bearish, traders should remain vigilant for potential reversals or breakouts that could occur with shifting market conditions.
Frequently Asked Questions
What caused the SUIUSDT price drop?
The 7.1% decline resulted from a combination of technical breakdowns below key support levels and strong bearish momentum confirmed by multiple indicators.
Is this a good time to buy SUIUSDT?
Current technicals suggest caution. The strong bearish momentum and lack of reversal signals indicate waiting for confirmation of support might be prudent.
How significant is the 61.8% Fibonacci level?
This golden ratio often acts as strong support or resistance. The current alignment suggests it may serve as important resistance if price attempts to recover.
What volume levels indicate a potential reversal?
Watch for increasing volume on up moves that break through resistance levels, which could signal buyer interest returning to the market.
How long might this bearish trend last?
Market trends can change rapidly in crypto. Monitor key levels and indicators for signs of momentum shifting before assuming trend duration.
Related News
- Stablecoin Market Cap Faces Alarming Stagnation at $310 Billion Amid Regulatory Crackdown
- Bitcoin $100K Surge Accelerates as Macroeconomic Tailwinds Clear Major Hurdles
- US Stocks Close Higher with Impressive Rally: S&P 500, Nasdaq, and Dow Jones All Post Gains