XRP, the digital asset associated with Ripple Labs, experienced a significant technical breakdown this week, falling decisively below a crucial trading range that had provided support for months. This development signals potentially sustained bearish momentum for the cryptocurrency, according to market analysts and technical indicators. The breakdown occurred amid broader cryptocurrency market weakness and regulatory uncertainty, raising concerns about XRP’s near-term price trajectory.
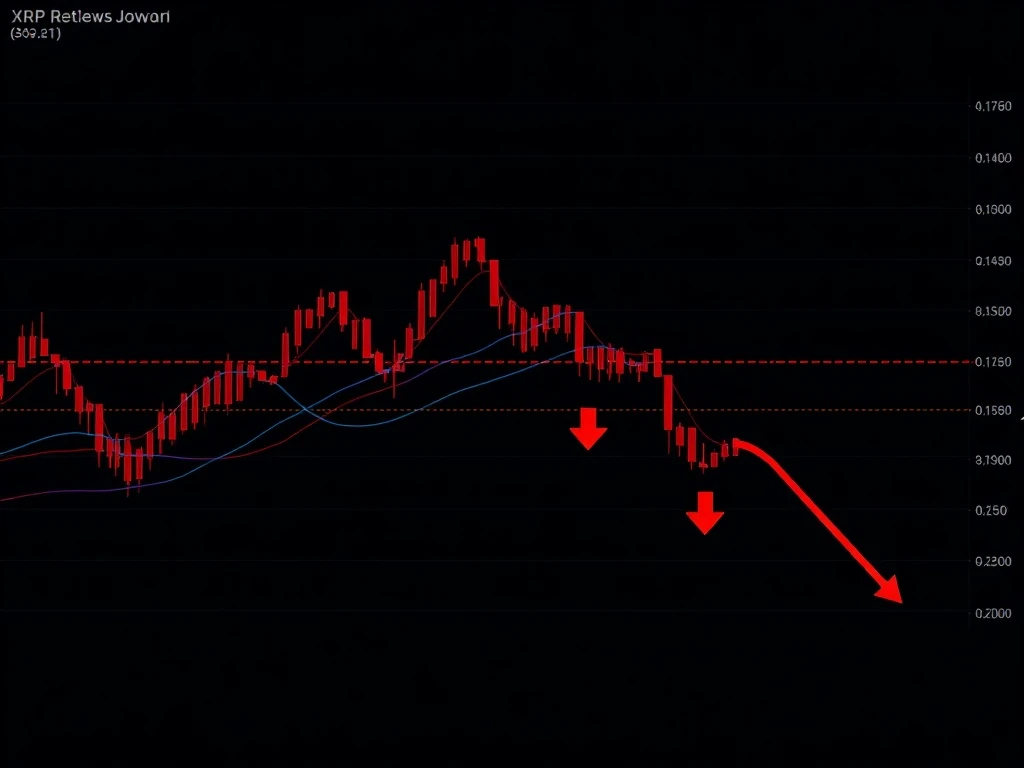
XRP Price Breakdown: Technical Analysis Reveals Bearish Signals
Technical analysts observed XRP breaking below the $0.52-$0.58 trading range that had contained price action since early 2024. This range breakdown represents a critical technical event with several concerning implications. First, the breakdown occurred on increasing volume, confirming genuine selling pressure rather than temporary volatility. Second, multiple support levels failed simultaneously, indicating broad-based weakness in the asset’s market structure.
Several key technical indicators now point to continued downward pressure. The 50-day moving average crossed below the 200-day moving average in what technical analysts call a “death cross.” This bearish signal typically precedes extended declines. Additionally, the Relative Strength Index (RSI) dropped below 30, entering oversold territory but without showing signs of reversal momentum. Trading volume patterns reveal consistent selling pressure throughout the breakdown period.
Market Context and Contributing Factors
The XRP breakdown coincides with several market-wide developments affecting cryptocurrency valuations. Regulatory uncertainty continues to impact investor sentiment, particularly following recent SEC actions against other digital assets. Furthermore, macroeconomic conditions including interest rate decisions and inflation data have reduced risk appetite across financial markets. Cryptocurrency correlations with traditional markets have strengthened during this period, amplifying downward pressure.
Historical Patterns and Comparative Analysis
Historical data reveals concerning parallels between current XRP price action and previous bear market phases. The 2018 cryptocurrency downturn featured similar range breakdowns that preceded extended declines of 60-80% from breakdown points. While market conditions differ today, the technical patterns show striking similarities in structure and momentum characteristics.
Comparative analysis with other major cryptocurrencies provides additional context. Bitcoin and Ethereum have also faced selling pressure but maintained stronger technical structures than XRP. This relative weakness suggests XRP may face disproportionate selling pressure during market downturns. The following table illustrates key technical differences:
| Cryptocurrency | Support Level Breached | Volume During Decline | RSI Level |
|---|---|---|---|
| XRP | Multiple levels | High and increasing | 28 (oversold) |
| Bitcoin | One major level | Moderate | 35 |
| Ethereum | Testing support | Moderate | 32 |
This comparative weakness raises questions about XRP’s fundamental positioning within the cryptocurrency ecosystem. Market participants increasingly differentiate between assets based on utility, adoption, and regulatory clarity rather than treating cryptocurrencies as a homogeneous asset class.
Expert Perspectives on XRP’s Technical Outlook
Financial analysts specializing in cryptocurrency markets emphasize the significance of this technical breakdown. According to market technicians, the breakdown from the established trading range represents more than routine volatility. The sustained nature of the decline, combined with volume confirmation, suggests genuine shifts in market sentiment and positioning.
Several key factors experts monitor include:
- Volume confirmation: High volume during breakdowns validates the price movement
- Timeframe alignment: Bearish signals appearing across multiple timeframes
- Market structure damage: Breakdown of established support levels
- Sentiment indicators: Shifts in investor positioning and expectations
Technical analysts note that recovery from such breakdowns typically requires substantial time and fundamental catalysts. Without significant positive developments, XRP may establish new, lower trading ranges as market participants adjust their valuation models.
Fundamental Considerations and Network Activity
Beyond technical factors, fundamental metrics provide additional context for XRP’s price action. Network activity, transaction volumes, and adoption metrics offer insights into the asset’s underlying utility. Recent data shows mixed signals, with some adoption metrics improving while others stagnate. This fundamental ambiguity complicates price analysis and contributes to market uncertainty.
Regulatory developments continue to influence XRP’s market positioning. The ongoing evolution of cryptocurrency regulation creates both challenges and opportunities for assets like XRP. Market participants closely monitor regulatory clarity, as it significantly impacts institutional adoption and mainstream integration.
Potential Scenarios and Price Targets
Technical analysis suggests several potential scenarios following the range breakdown. The most immediate concern involves further declines toward next support levels. Historical volatility patterns and Fibonacci retracement levels provide potential downside targets that technical analysts monitor closely.
Market participants should consider multiple factors when assessing XRP’s trajectory:
- Broader market conditions: Cryptocurrency correlation patterns
- Regulatory developments: Impact on adoption and institutional interest
- Technical indicators: Momentum, volume, and pattern completion
- Fundamental metrics: Network growth and utility development
While bearish momentum currently dominates, market conditions can change rapidly. Technical analysts emphasize the importance of monitoring for reversal signals, though such signals remain absent in current price action. The absence of bullish divergence on momentum indicators suggests continued downward pressure.
Risk Management Considerations for Investors
Current market conditions necessitate careful risk management approaches. The breakdown from established trading ranges increases volatility and uncertainty. Investors and traders should adjust position sizes and risk parameters accordingly. Technical breakdowns often precede extended periods of consolidation or further declines, requiring patience and disciplined risk management.
Several risk management principles apply particularly to current XRP market conditions:
- Position sizing: Reducing exposure during breakdown periods
- Stop-loss placement: Technical levels below breakdown points
- Diversification: Across cryptocurrency and traditional assets
- Time horizon alignment: Matching investment strategies to market conditions
Market professionals emphasize that technical breakdowns represent information rather than predictions. The information suggests increased risk and potential for further declines, but market conditions can change based on new developments. Adaptive strategies that respond to changing conditions typically outperform rigid approaches during volatile periods.
Conclusion
XRP’s breakdown from its established trading range represents a significant technical development with implications for near-term price action. The sustained bearish momentum, confirmed by volume and multiple technical indicators, suggests potential for further declines. Market participants should monitor key support levels and broader cryptocurrency market conditions while maintaining disciplined risk management approaches. The XRP price action reflects both asset-specific factors and broader market trends, requiring comprehensive analysis for informed decision-making.
FAQs
Q1: What does “breakdown from trading range” mean for XRP?
A trading range breakdown occurs when an asset’s price moves decisively below established support levels that previously contained price action. For XRP, this signals potential for sustained downward movement as previous buyers become sellers and new support levels must be established.
Q2: How long might bearish momentum continue for XRP?
Technical analysis cannot predict exact durations, but historical patterns suggest breakdowns often lead to extended periods of weakness or consolidation. The absence of reversal signals in current momentum indicators suggests bearish pressure may continue until new catalysts emerge.
Q3: What support levels should investors watch for XRP?
Technical analysts monitor several key levels, including previous swing lows and Fibonacci retracement levels. The next significant support typically resides 10-15% below breakdown points, though exact levels depend on market structure and volume patterns.
Q4: Does this breakdown affect XRP’s long-term prospects?
Short-term technical breakdowns don’t necessarily determine long-term fundamentals. However, they can impact investor psychology and market structure. Long-term prospects depend more on adoption, utility, and regulatory developments than short-term price movements.
Q5: How does XRP’s performance compare to other cryptocurrencies during this period?
XRP has shown relative weakness compared to major cryptocurrencies like Bitcoin and Ethereum. This underperformance suggests asset-specific factors may be amplifying broader market weakness, requiring separate analysis from general cryptocurrency trends.
Related News
- Monero Plummets 40% From All-Time High as India’s Devastating Crackdown Targets Privacy Coins
- Crypto Futures Liquidated: Staggering $154 Million Hourly Wipeout Shakes Markets
- Bitcoin Price Plummets Below $87,000: Analyzing the Sudden Market Downturn