The cryptocurrency market often presents dynamic shifts. Recently, XRP has captured significant attention. Traders and investors are closely watching its movements. A recent analysis highlights a concerning trend for the digital asset. XRP has entered a distinct downward technical channel. This development has prompted close scrutiny from market participants. Understanding these technical patterns is crucial for informed decision-making.
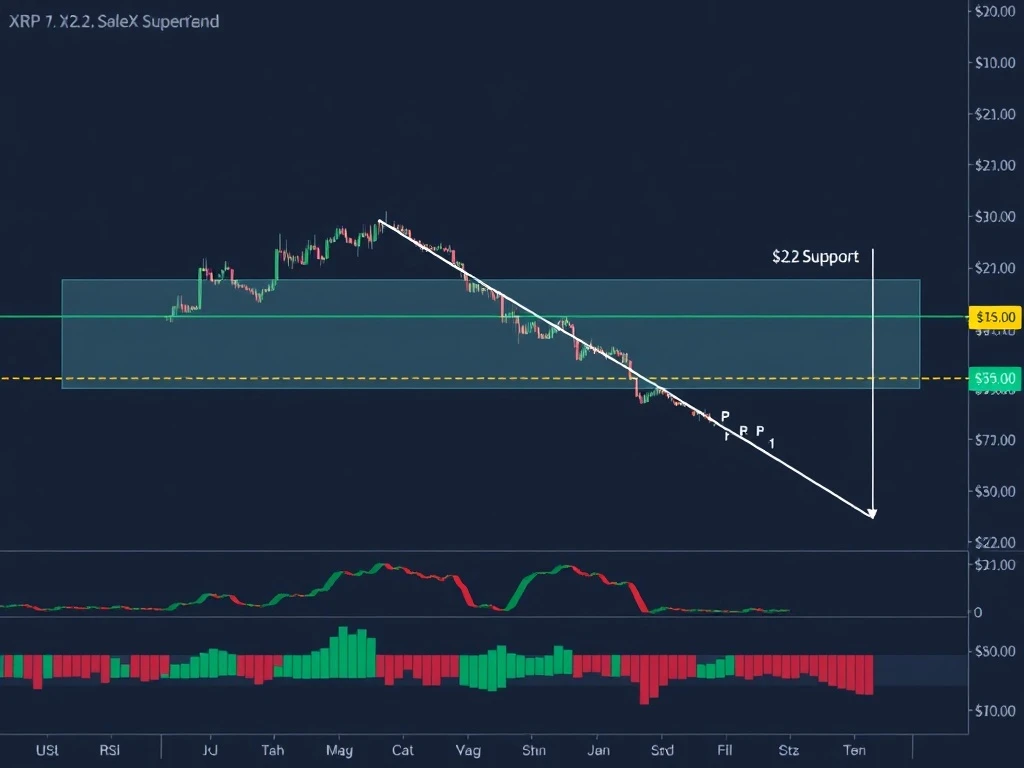
Understanding the XRP Downward Channel
The **XRP downward channel** represents a clear technical pattern. This channel forms when an asset’s price consistently moves between two parallel, descending trend lines. CoinDesk’s analysis confirms this pattern on the four-hour chart. The formation became evident after XRP repeatedly failed to overcome the $2.4 resistance level. Subsequently, the asset slipped below the $2.28 support line. This price action solidifies the bearish outlook for the immediate term. Furthermore, such channels often signal continued downward pressure. Traders typically view these patterns as opportunities for short-term bearish strategies. Conversely, a breakout above the channel could indicate a trend reversal. Therefore, monitoring the channel’s boundaries is essential for market participants.
Several factors contribute to the formation of such a channel. Decreased buying pressure is a primary driver. Increased selling activity also plays a role. This combination pushes the price lower. The consistent retesting of the upper trendline without a successful breakout reinforces the channel’s validity. Consequently, each rejection from the upper boundary strengthens the bearish sentiment. Investors must recognize these patterns. They provide valuable insights into potential future price movements. Active traders use these channels to define entry and exit points. However, channels can break, leading to significant price volatility.
Focus on the Crucial XRP Support Level at $2.2
The **XRP support level** at $2.2 has become a pivotal point. This level now represents a critical short-term defense for the asset. Historically, support levels act as floors for price action. They indicate areas where buying interest might emerge. A daily close below the $2.28 line has already occurred. This move puts increased pressure on the $2.2 mark. If XRP fails to hold this level, further declines could follow. This scenario would trigger stop-loss orders. It could also deter new buyers. Therefore, the market watches $2.2 with heightened anticipation. Its importance cannot be overstated for current XRP holders.
Moreover, the strength of a support level depends on various factors. Previous price action around that level is one indicator. Trading volume also plays a significant role. High volume at a support level suggests strong buying interest. Conversely, a low volume breakdown is more concerning. It indicates a lack of buyers to defend the price. For XRP, the $2.2 level carries psychological weight. Many traders set their limits around such round numbers. Its ability to hold will likely dictate the next phase of XRP’s price trajectory. Failure to maintain this support could lead to a retest of lower price ranges.
Navigating the XRP Resistance at $2.4
The $2.4 mark has emerged as a formidable **XRP resistance** level. Resistance levels act as ceilings for price movements. They signify areas where selling pressure tends to increase. XRP’s repeated failures to break above this threshold confirm its strength. Each attempt met with renewed selling. This pattern suggests a significant supply of XRP at or around $2.4. Overcoming this resistance is crucial for any bullish reversal. A sustained move above $2.4 could signal a shift in market sentiment. It would invalidate the current downward channel. This would pave the way for potential price recovery.
Furthermore, breaking a strong resistance level often requires substantial buying volume. Without this, price attempts tend to be short-lived. Traders look for confirmation before committing to new long positions. A daily close above $2.28 could signal a renewed attempt. However, the path to $2.4 remains challenging. The current technical indicators reinforce this difficulty. Market sentiment also plays a role in resistance breakthroughs. Positive news or broader market rallies can provide the necessary momentum. Conversely, a lack of catalysts can keep prices suppressed. Therefore, vigilance around this level is paramount for traders.
Diving into Crypto Technical Indicators: RSI and MACD Insights
The current **crypto technical indicators** paint a bearish picture for XRP. The Relative Strength Index (RSI) offers valuable insights. It measures the speed and change of price movements. The RSI has moved from neutral territory into oversold territory. This development suggests that selling pressure has been intense. However, an oversold RSI can sometimes precede a bounce. It does not guarantee one. Traders often look for divergence between price and RSI. Such divergences can signal potential reversals. Yet, in strong downtrends, RSI can remain oversold for extended periods. Therefore, relying solely on RSI can be misleading.
The Moving Average Convergence Divergence (MACD) also provides a bearish signal. It measures the relationship between two moving averages. The MACD has formed a death cross. This event marks the first time in two weeks. A death cross occurs when the short-term moving average crosses below the long-term moving average. It is widely considered a bearish signal. This crossover indicates weakening momentum. It often precedes further price declines. Both the RSI and MACD signals reinforce the downward channel’s implications. These indicators suggest caution for short-term traders. They highlight the prevailing bearish sentiment in the market. Consequently, many investors adopt a wait-and-see approach.
What to Watch For: Key Variables in XRP’s Price Action
The immediate future for XRP hinges on a few key variables. First, the $2.2 level must hold as short-term support. A failure here could accelerate declines. Traders should monitor daily closes below this critical point. Second, a daily close above $2.28 would be a positive sign. This could signal a renewed attempt to challenge the $2.4 resistance. Such a move would indicate some buying interest. It might suggest a temporary relief rally. Third, watch for trading volume. A significant increase in buying volume could signal a reversal. Conversely, low volume during price declines is a bearish sign. These are important metrics.
Finally, broader market sentiment also impacts XRP. The overall health of the cryptocurrency market influences individual assets. A strong Bitcoin rally often lifts altcoins like XRP. Conversely, a Bitcoin correction can drag them down. Therefore, monitoring Bitcoin’s price action is crucial. Any significant news regarding Ripple’s ongoing legal situation could also affect XRP. Positive developments could provide a much-needed catalyst. Negative news could exacerbate the current downtrend. Staying informed about all these variables is key. It helps in making timely trading decisions.
In conclusion, XRP faces significant technical challenges. The downward channel is clearly established. Key support and resistance levels are in focus. Technical indicators further reinforce the bearish outlook. Traders must remain vigilant. They should observe the $2.2 support and $2.4 resistance levels closely. A potential daily close above $2.28 could offer a glimmer of hope. However, the path ahead appears challenging. Prudent risk management remains essential for all participants in the XRP market.
Frequently Asked Questions (FAQs)
Q1: What does the XRP downward channel signify?
A1: The XRP downward channel signifies a sustained period of bearish price action. The price consistently moves between two parallel, descending trend lines. This pattern suggests continued selling pressure and weakening buyer interest. It often precedes further price declines unless a strong breakout occurs.
Q2: Why is the $2.2 XRP support level so important?
A2: The $2.2 XRP support level is crucial because it represents a key psychological and technical floor for the price. If XRP fails to hold this level, it could trigger further selling and lead to significant price declines. It’s a critical point where buyers might step in to prevent a deeper fall.
Q3: What does the $2.4 XRP resistance level indicate?
A3: The $2.4 XRP resistance level indicates a price point where selling pressure is strong. XRP has repeatedly failed to break above this level, suggesting a significant supply of sellers at this price. Overcoming this resistance is essential for any potential bullish reversal and to exit the current downward trend.
Q4: How do crypto technical indicators like RSI and MACD influence XRP’s outlook?
A4: Crypto technical indicators like RSI and MACD provide insights into price momentum and trend strength. The RSI moving into oversold territory suggests intense selling pressure. The MACD forming a death cross indicates weakening bullish momentum and a potential for further declines. Both signals reinforce the current bearish outlook for XRP.
Q5: What should traders watch for to predict XRP’s next move?
A5: Traders should watch several key variables. These include XRP’s ability to hold the $2.2 support level. They should also monitor for a daily close above $2.28, which could signal a renewed attempt at $2.4 resistance. Additionally, observing trading volume and broader cryptocurrency market sentiment is crucial for predicting XRP’s next move.
Related News
- Bitcoin’s Critical Showdown: Can Bulls Defend the $95K Fortress Against Mounting Pressure?
- Bitcoin Surges Toward $100K Milestone as Ordinals Protocol Sparks Unprecedented Blockchain Revolution
- Venezuela Cryptocurrency Crisis: Explosive Trump ‘Gasolina’ Links and Brazil’s Stablecoin Tax Battle Reshape Latin America