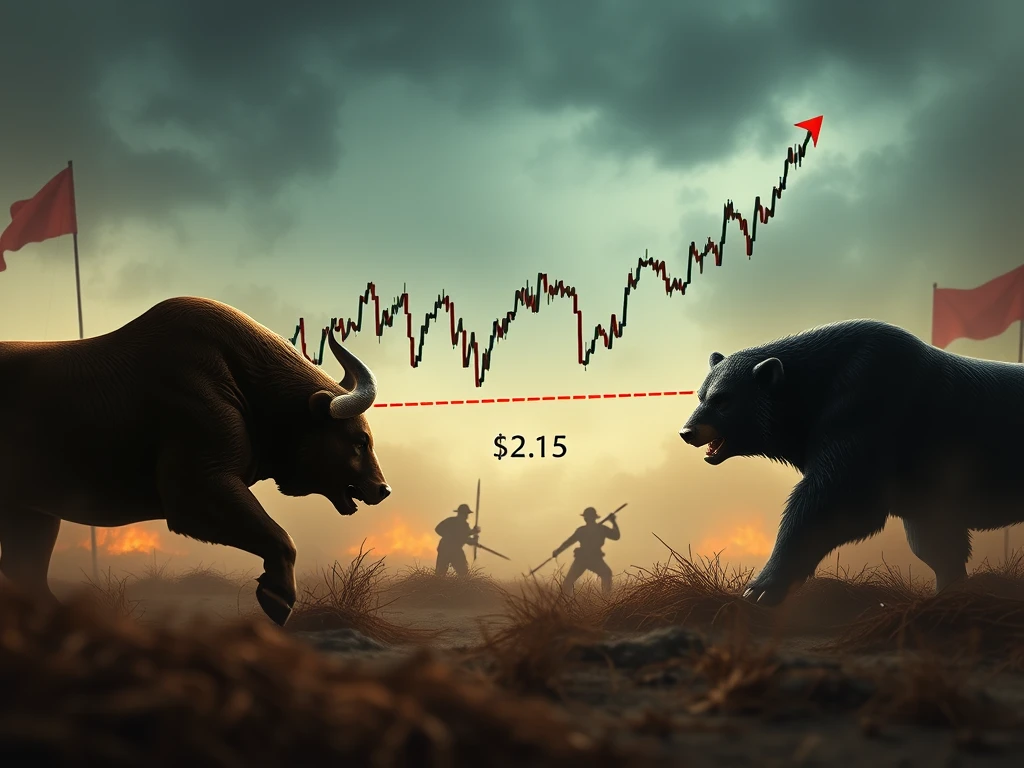
Is XRP on the verge of a significant price breakout? All eyes are on XRP as technical indicators suggest a tightening consolidation phase, with the critical $2.15 resistance level looming large. For crypto enthusiasts tracking XRP price movements, understanding these technical signals is paramount. Let’s dive deep into the XRP charts and decipher what these tightening technicals could mean for its next price surge.
Decoding XRP Technical Analysis: What’s Happening?
Recent XRP price action has been characterized by a narrowing trading range, a classic sign of technical consolidation. This ‘tightening’ isn’t just random noise; it often precedes a significant price movement. Think of it like a spring coiling tighter and tighter – the more compressed it becomes, the more explosive the potential release. But in which direction will XRP spring?
Here’s a breakdown of what technical analysts are observing:
- Consolidating Price Range: XRP’s price has been oscillating within a progressively smaller range, indicating indecision in the market but also building potential energy.
- Key Moving Averages: Keep a close watch on key moving averages like the 50-day and 200-day. Their relative positions and interactions can provide clues about trend direction. Are they converging, diverging, or crossing? These are crucial signals for traders.
- Volume Analysis: Has trading volume been decreasing during this consolidation phase? Lower volume during consolidation, followed by a spike on a breakout attempt, is a typical pattern to watch for.
- Chart Patterns: Are any recognizable chart patterns forming? Triangles, wedges, or flags could offer insights into potential breakout directions. Identifying these patterns is a key skill in technical analysis.
$2.15 Resistance: The Battleground for XRP Bulls
The $2.15 level has emerged as a significant resistance zone for XRP. Why is this level so important? Resistance levels in technical analysis represent price points where selling pressure historically overcomes buying pressure. In simpler terms, it’s a price ceiling that XRP has struggled to break above consistently.
Why is $2.15 a Tough Nut to Crack?
- Psychological Barrier: Round numbers and prior price peaks often act as psychological resistance. Traders may have sell orders clustered around this level, anticipating a rejection.
- Profit Taking Zone: Investors who bought XRP at lower prices might see $2.15 as an attractive level to take profits, increasing selling pressure.
- Technical Indicators Aligning: It’s possible that various technical indicators, when combined, are signaling overbought conditions or potential trend exhaustion around this price point.
For XRP to initiate a more substantial upward move, decisively breaching and holding above this $2.15 resistance is essential. A successful breakout could signal renewed bullish momentum.
XRP Price Prediction: Navigating Potential Scenarios
Predicting crypto prices with certainty is impossible, but technical analysis helps us explore potential scenarios based on current market dynamics. Let’s consider a few possibilities for XRP’s price trajectory:
| Scenario | Description | Potential Price Action |
|---|---|---|
| Bullish Breakout | XRP successfully breaks above $2.15 resistance with strong volume. | Potential surge towards next resistance levels (e.g., $2.30, $2.50), fueled by renewed buying interest and momentum. |
| Resistance Rejection | XRP attempts to break $2.15 but fails, facing strong selling pressure. | Price retracement back towards support levels (e.g., previous consolidation range lows, key moving averages). |
| Continued Consolidation | XRP remains within the tightening range, unable to decisively break resistance or support. | Sideways price action, market indecision persists, waiting for a catalyst or stronger directional signal. |
Traders and investors should closely monitor price action around the $2.15 level and key technical indicators to gauge which scenario is becoming more probable. Remember, risk management is crucial in crypto trading. Always consider using stop-loss orders and managing your position sizes.
Crypto Price Watch: Staying Ahead of the Curve
The cryptocurrency market is known for its volatility and rapid price swings. Staying informed and employing tools like technical analysis can provide a significant edge. Here are some tips for keeping a close crypto price watch and navigating these dynamic markets:
- Utilize Charting Tools: Platforms like TradingView, CoinGecko, and CoinMarketCap offer robust charting tools to analyze price action and technical indicators.
- Follow Market News: Stay updated on relevant news events, regulatory developments, and project-specific announcements that can impact crypto prices.
- Community Sentiment: Monitor social media, forums, and crypto communities to gauge market sentiment and identify potential shifts in investor behavior.
- Learn Technical Analysis: Invest time in learning the basics of technical analysis. Understanding chart patterns, indicators, and price action can empower your trading decisions.
By actively engaging in a crypto price watch and understanding technical analysis, you can better anticipate potential market movements and make more informed decisions in the exciting world of cryptocurrencies.
Conclusion: XRP’s Crucial Juncture
XRP finds itself at a critical juncture. The tightening technicals and the formidable $2.15 resistance level point to a potential turning point. Whether XRP breaks through to new highs or faces rejection at this key battlefield remains to be seen. For those tracking XRP and the broader crypto market, diligent monitoring of price action, technical indicators, and market sentiment will be essential to navigate the days and weeks ahead. The stage is set for a potentially significant move – are you ready to watch it unfold?